The Applied Scientist Title Hides Two Very Different Roles
"Applied Scientist" reads like a single job title, but it isn't. Inside the same keyword sit at least two distinct roles: the product-science flavor (experimentation, causal inference, A/B testing, recommendation systems) that lives at consumer tech companies, and the research-lab flavor (biostatistics, clinical research, biotech R&D, applied physics) that lives at universities, hospitals, and pharma. In the live market, the second flavor is more common than most candidates expect.
To put numbers on it, we looked at every active Applied Scientist posting on the InterviewStack.io job board as of May 2026: 3,146 listings, with skills extracted from descriptions and synonyms collapsed (so ETL and data pipelines count once, GCP and Google Cloud count once).
The most distinctive structural feature of the role: no single skill clears the 50% line. The Applied Scientist title is fragmented enough that the most common individual skill, A/B Testing, appears in only 26.3% of postings. Compare that to Data Engineer, where three skills cluster around 71-74%. There is no canonical Applied Scientist stack in the way there is a canonical Data Engineer stack.
Key Findings
- 3,146 active Applied Scientist postings analyzed across the live job board as of May 2026.
- No table-stakes tier exists: the most-requested skill, A/B Testing, appears in only 26.3% of postings (828 of 3,146). Python (25.4%) and Statistics (24.6%) follow.
- Statistics & Experimentation is the dominant skill family at 44.6% of postings, ahead of Coding Languages (28.3%) and Machine Learning & AI (19.3%).
- Median US base salary is $110,000 across 878 postings with US salary disclosed; equity, bonus, and sign-on are not in the data.
- Deep-learning specialists earn $145,300 in median US base salary (PyTorch and Deep Learning both n=60+), about $35K above the role baseline.
- Mid-level dominates at 60.6% (1,905 postings); entry-level is 14.2% (446), markedly more accessible than Data Engineer's 3%.
- 60.9% of postings are in the US, with Singapore (6.0%), the UK (5.2%), Canada (4.8%), and India (3.9%) rounding out the next tier.
- Onsite is the dominant work mode at 77.1% of postings; remote is just 9.9%, reflecting the heavy academia, healthcare, and pharma presence in the employer mix.
What Skill Families Define an Applied Scientist Role in 2026?
Group every individual skill into the higher-level family it belongs to and count how many postings ask for at least one skill in that family. The shape of the role becomes a fan of related specialties rather than a single stack.
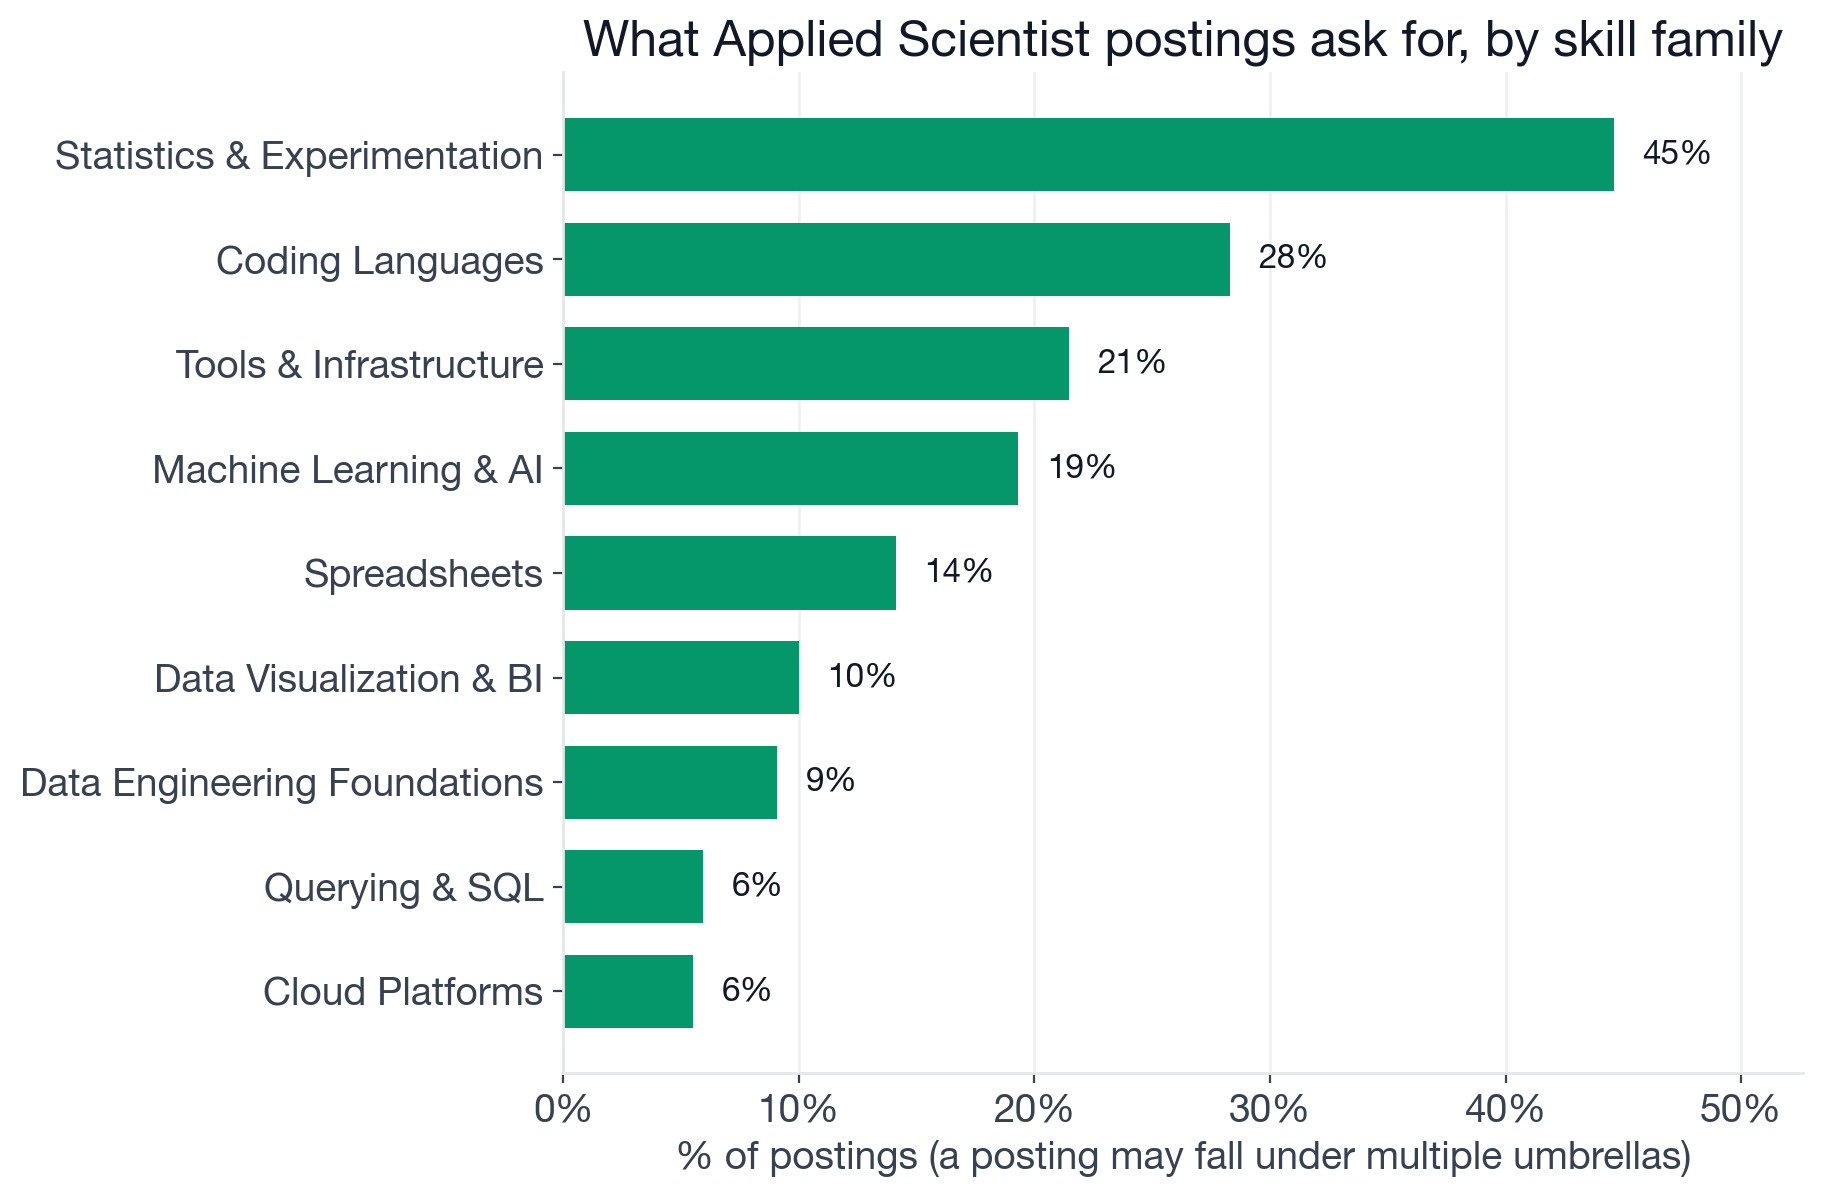
Share of Applied Scientist postings that ask for at least one skill in each family. A posting that mentions both A/B Testing and Statistics counts once under "Statistics & Experimentation".
The families that actually define the role:
- Statistics & Experimentation: 44.6% (A/B testing, statistical inference, forecasting)
- Coding Languages: 28.3% (overwhelmingly Python; TypeScript is a long-tail noise term)
- Tools & Infrastructure: 21.5% (monitoring of deployed models, experiment automation)
- Machine Learning & AI: 19.3% (classical ML, deep learning, PyTorch, LLMs, generative AI)
- Spreadsheets: 14.1% (essentially Excel, mostly in clinical and life-sciences postings)
- Data Visualization & BI: 10.0% (generic visualization, plus Tableau and Power BI as a long tail)
- Data Engineering Foundations: 9.1% (data quality, data pipelines)
- Querying & SQL: 5.9% (almost entirely SQL itself)
- Cloud Platforms: 5.5% (Google Cloud and AWS roughly tied)
A few things stand out against Data Engineer and AI Engineer postings. Statistics & Experimentation, which sits at 17% for Data Engineer, leads the Applied Scientist field at 44.6%; this is the single biggest differentiator from neighboring roles. Querying & SQL, which dominates analyst and engineer hiring, sits at just 5.9% for Applied Scientist, the lowest of any role we have analyzed. And Spreadsheets at 14.1% reflects how much of the hiring comes from clinical research, biostatistics, and lab-applied-science postings where Excel is still a primary analytics tool.
What Are the Three Tiers of Individual Applied Scientist Skills?
Drill into individual skills and three tiers appear, with one important caveat: the top tier is empty.
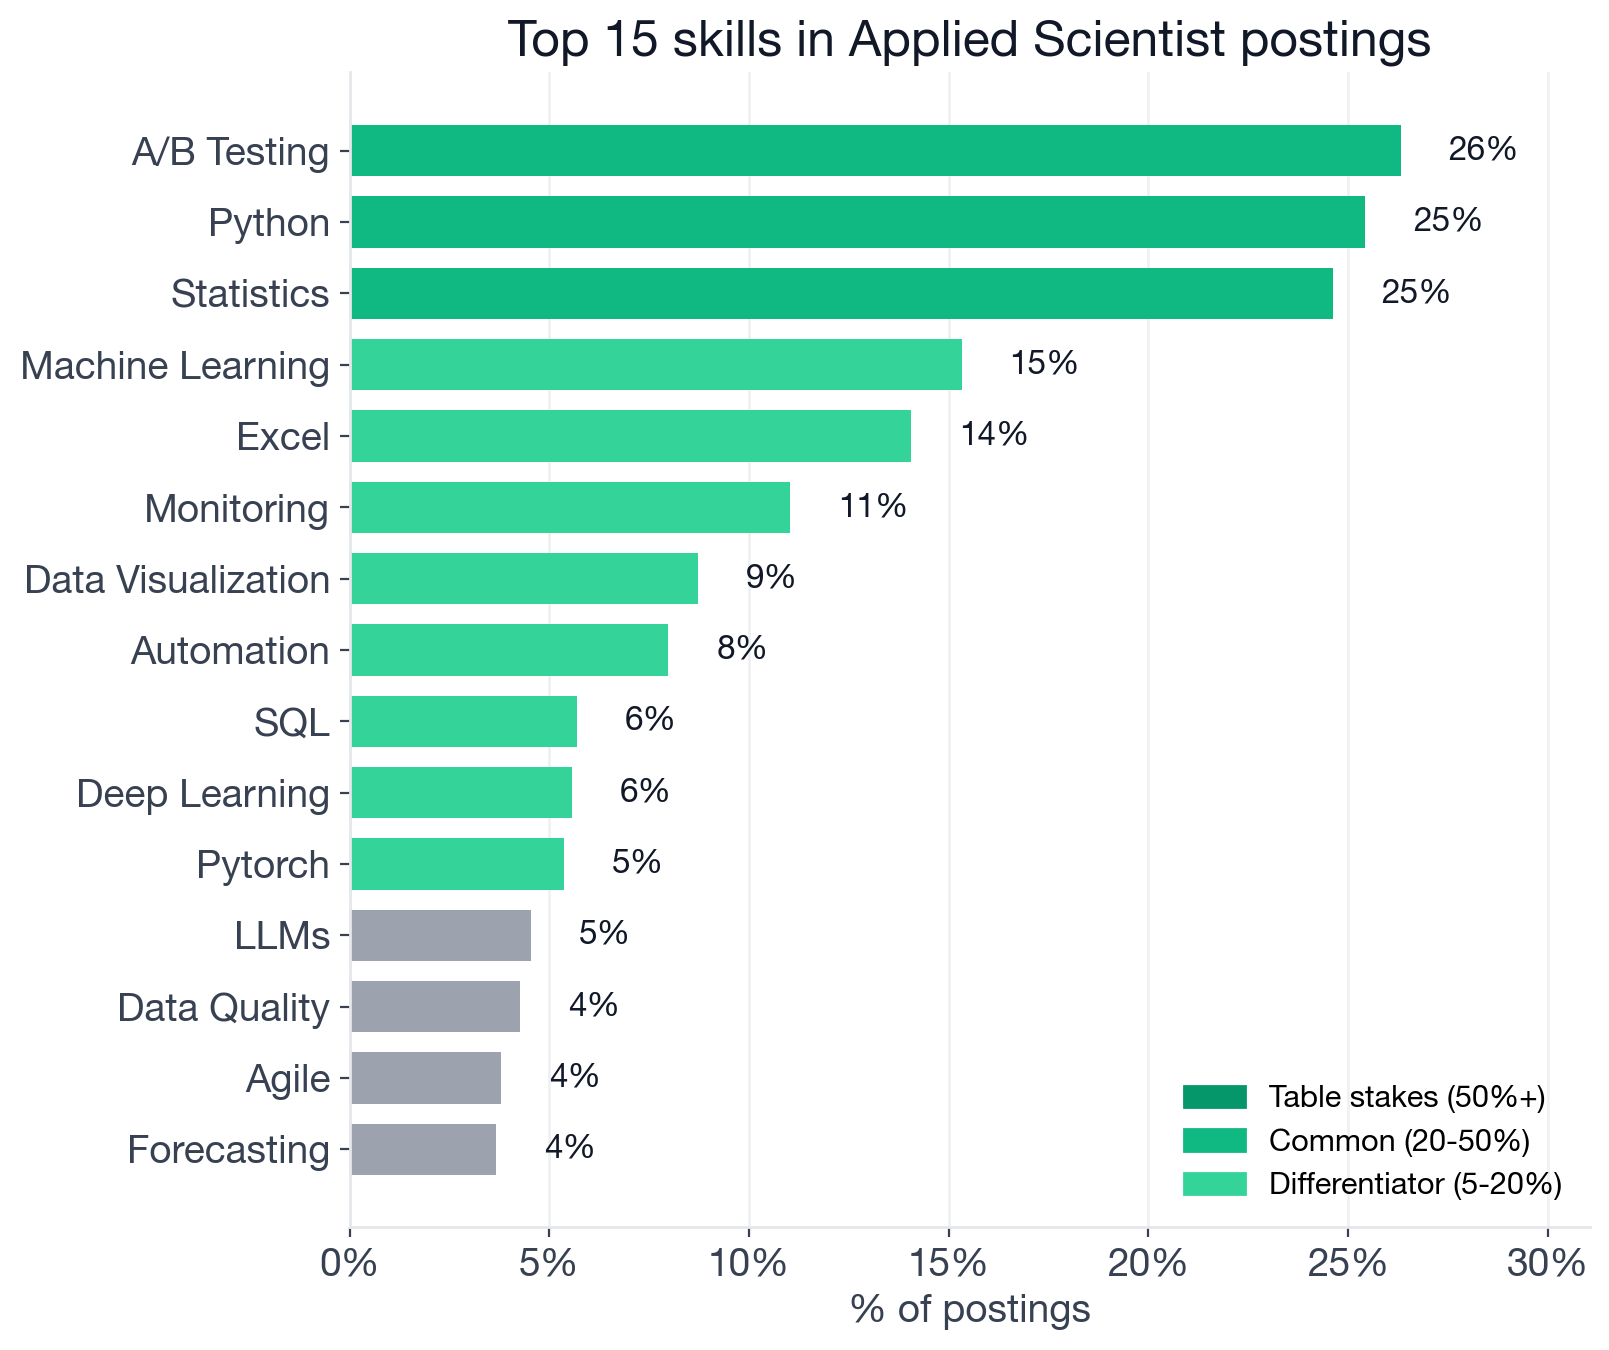
Top individual skills in Applied Scientist postings, by share of listings that mention them. Skills above 50% would be table stakes; 20-50% are common; 5-20% are differentiators. Generic role keywords and universal soft skills are filtered before counting.
Table Stakes (50%+ of postings)
There are none. No individual skill appears in more than half of Applied Scientist postings. The role is structurally too fragmented across product-science, research, and ML-building subspecialties for any one skill to be universal. This is the single most useful framing for a candidate: do not waste time trying to "cover everything." Pick a flavor of the role and concentrate.
Common Expectations (20-50% of postings)
Three skills cluster in the common tier, and they are exactly the three you would expect from an experimentation-oriented role:
- A/B Testing: 26.3%
- Python: 25.4% (Applied Scientist + Python openings)
- Statistics: 24.6% (Applied Scientist + Statistics openings)
The three travel together. Python plus Statistics co-occur in 369 postings (11.7% of the market, lift 1.87), and A/B Testing plus Statistics co-occur in 264 postings (8.4%, lift 1.29). A candidate competent in all three is positioned for the experimentation-heavy product-science version of the role, which is the most consistently defined flavor in the dataset.
Differentiators (5-20% of postings)
This tier is where Applied Scientist subspecialties separate.
- Machine Learning: 15.3% (Applied Scientist + Machine Learning openings)
- Excel: 14.0%
- Monitoring: 11.0%
- Data Visualization: 8.7%
- Automation: 8.0%
- SQL: 5.7%
- Deep Learning: 5.6%
- PyTorch: 5.4% (Applied Scientist + PyTorch openings)
Three groupings sit inside this tier. Machine Learning, Deep Learning, and PyTorch (5-15%) are the model-building flavor of the role. Excel and SQL are the analytics-and-reporting flavor (notably, SQL is unusually low for a role family adjacent to data analytics, which tells you most Applied Scientist work happens in Python notebooks on extracted data, not directly in a warehouse). Monitoring and Automation are infrastructure-leaning differentiators for postings that ask the scientist to ship and operate models, not just train them.
Of the newer AI-stack terms, only PyTorch (5.4%) clears into the differentiator tier; LLMs (4.5%) and Generative AI (3.6%) still sit below the 5% cutoff in noise territory, though both are rising fast (a year ago all three were well below noise).
Which Applied Scientist Skills Pay More Than the Baseline?
Salary numbers below are restricted to US postings only (where wage-transparency laws produce consistent disclosure) so they are directly comparable. The numbers are base salary: equity, bonuses, RSUs, and sign-on are not disclosed in postings, so total compensation at top employers is meaningfully higher than what we report here, especially in product-led tech.
The overall median US base salary for Applied Scientist postings is $110,000 (n=878). That sits below the Data Engineer median ($128,300) and below the AI Engineer median ($146,000), and the reason is in the employer mix: 38% of postings are in healthcare, education, biotech, or pharmaceutical industries, where base salaries are lower than they are in product-led tech. The Big-Tech Applied Scientist roles you might be picturing exist, but they are a slice of the market, not the bulk of it.
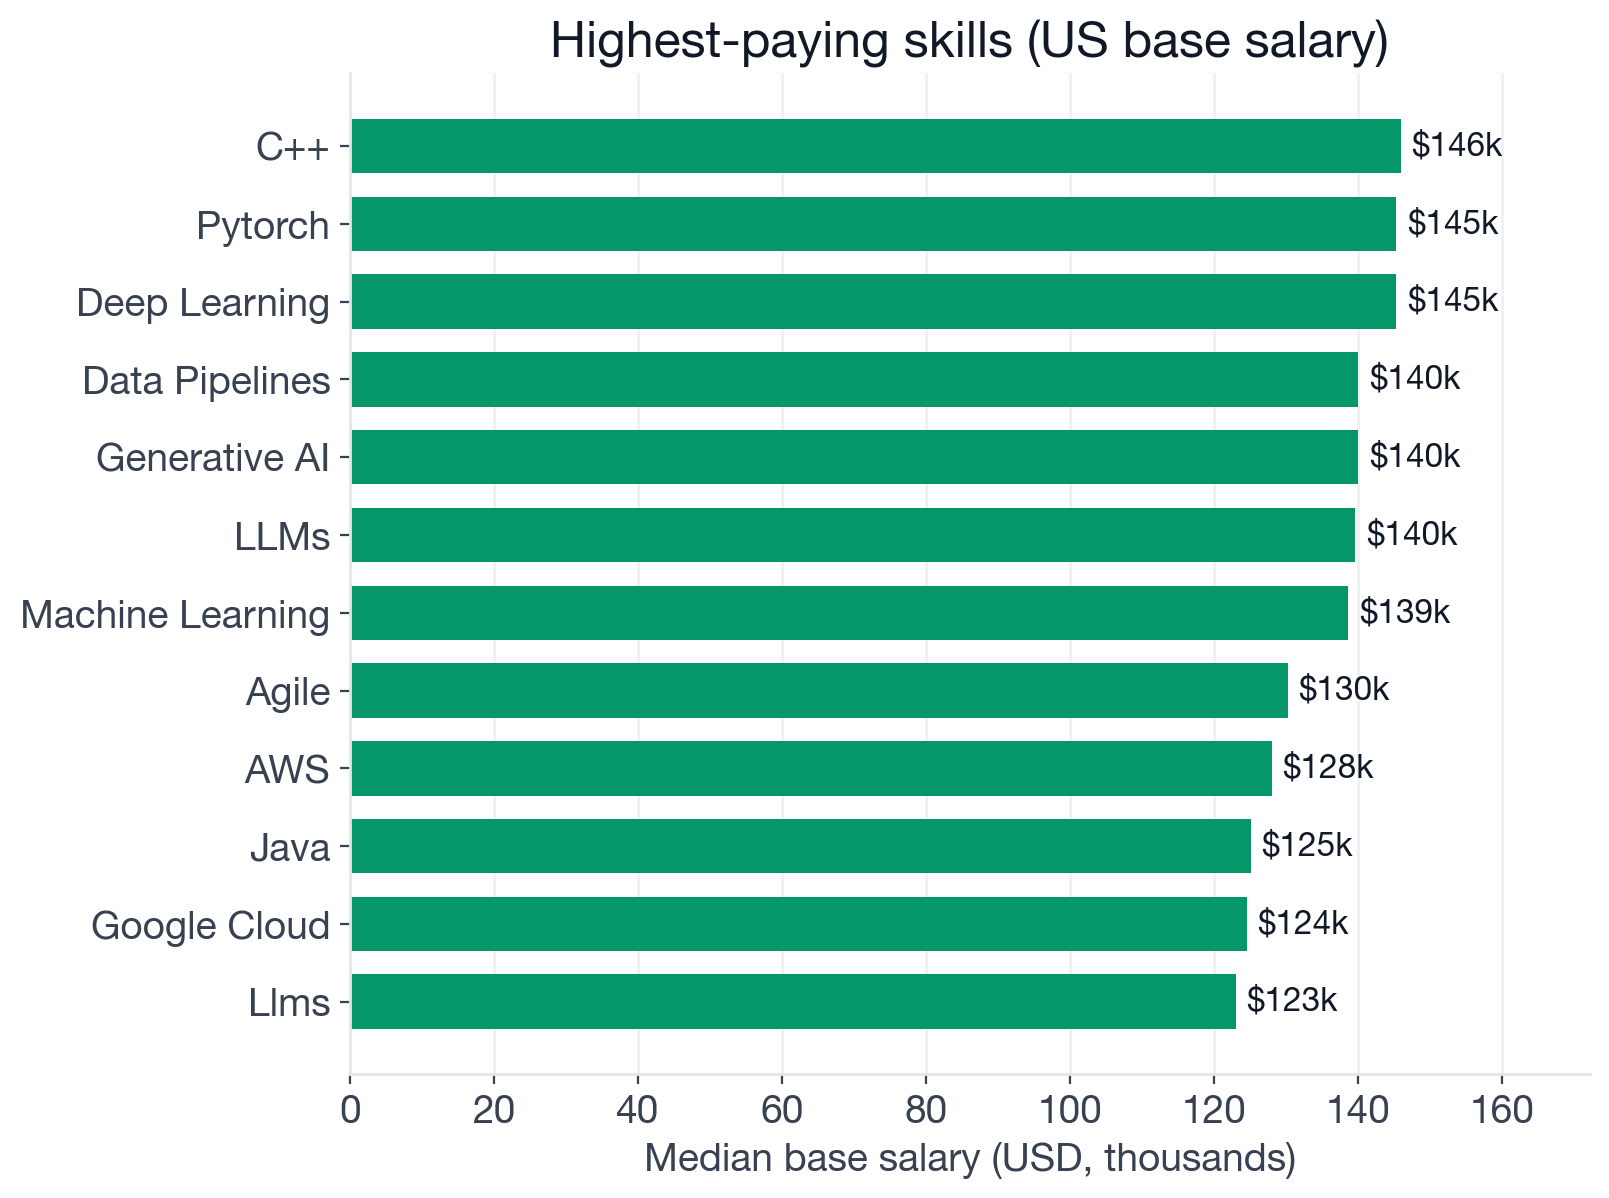
Median US base salary in USD for postings that mention each skill, among US Applied Scientist postings with structured salary data.
The skills with the largest premiums above the $110,000 baseline cluster around C++ and the deep-learning/modern-AI stack.
Premiums of roughly $30K to $36K:
- C++: $145,900 (n=25), about $35,900 above baseline
- PyTorch: $145,300 (n=62), about $35,300 above baseline
- Deep Learning: $145,300 (n=60), about $35,300 above baseline
- Data Pipelines: $140,000 (n=29), about $30,000 above baseline
- Generative AI: $140,000 (n=51), about $30,000 above baseline
Premiums of roughly $20K to $30K:
- LLMs: $139,600 (n=62), about $29,600 above baseline
- Machine Learning: $138,600 (n=169), about $28,600 above baseline
- Agile: $130,200 (n=34), about $20,200 above baseline
Premiums of roughly $10K to $20K:
- AWS: $128,000 (n=49), about $18,000 above baseline
- Java: $125,100 (n=27), about $15,100 above baseline
- Google Cloud: $124,500 (n=34), about $14,500 above baseline
- Python: $121,500 (n=257), about $11,500 above baseline
- Forecasting: $120,000 (n=45), about $10,000 above baseline
Skills near baseline (under $5K above):
- Statistics: $112,600 (n=273), about $2,600 above baseline
- SQL: $112,100 (n=69), about $2,100 above baseline
- A/B Testing: $110,000 (n=297), at baseline
And finally, skills that sit below the role baseline:
- Data Visualization: $96,200 (n=76), about $13,800 below baseline
- Monitoring: $95,500 (n=101), about $14,500 below baseline
- Excel: $85,000 (n=133), about $25,000 below baseline
- Power BI: $74,400 (n=26), about $35,600 below baseline
The below-baseline pattern is informative, not noise. Excel, Power BI, and generic data visualization show up most often in clinical research, university lab, and healthcare Applied Scientist postings, where base salaries are structurally lower than in product-led tech. Picking up Excel skills does not lower your salary; it correlates with the segment of the market that pays less. Read the median for what it is: a marker of which kind of Applied Scientist posting tends to mention each skill.
The practical takeaway: the experimentation-and-statistics version of the role pays roughly at baseline, the model-building version pays a $20K to $35K premium, and the research-and-reporting version sits below baseline. Pick the version you want to interview for, and let your skill mix match it.
What Is the Dominant Applied Scientist Skill Stack?
We computed every two-skill co-occurrence among the top 25 skills to find the combinations that show up together more often than chance. Two distinct stacks emerge.
| Skill pair | Postings that mention both | % of postings | Lift |
|---|---|---|---|
| Deep Learning + PyTorch | 95 | 3.0% | 10.11 |
| Deep Learning + Machine Learning | 147 | 4.7% | 5.48 |
| Machine Learning + PyTorch | 138 | 4.4% | 5.33 |
| LLMs + Machine Learning | 103 | 3.3% | 4.70 |
| Python + PyTorch | 159 | 5.1% | 3.70 |
| AWS + Python | 88 | 2.8% | 3.50 |
| Python + SQL | 155 | 4.9% | 3.41 |
| Deep Learning + Python | 148 | 4.7% | 3.33 |
| Machine Learning + Python | 350 | 11.1% | 2.86 |
| SQL + Statistics | 104 | 3.3% | 2.36 |
| Python + Statistics | 369 | 11.7% | 1.87 |
| Automation + Machine Learning | 76 | 2.4% | 1.98 |
| Machine Learning + Statistics | 230 | 7.3% | 1.94 |
| A/B Testing + Machine Learning | 177 | 5.6% | 1.40 |
| A/B Testing + Statistics | 264 | 8.4% | 1.29 |
The story is two stacks layered over the role:
- The broad experimentation stack is Python plus Statistics, the highest-volume pair at 369 postings (11.7% of the market, lift 1.87). Add A/B Testing as a third leg (264 postings with Statistics, lift 1.29) and you have the canonical product-science Applied Scientist: someone who designs experiments, runs hypothesis tests, and writes analysis in Python notebooks. This is the most consistently defined version of the role.
- The deep-learning specialty stack is Machine Learning plus Python (350 postings, 11.1%, lift 2.86), with a sharp PyTorch plus Deep Learning sub-pair (95 postings, lift 10.11). Lift above 10 is rare in any dataset: it means PyTorch and Deep Learning postings overlap nearly 10 times more than their individual frequencies would predict, because they are essentially the same skill in this market. Add LLMs or Generative AI on top and you have the modern-AI Applied Scientist building, fine-tuning, or evaluating models.
The two stacks barely overlap. Postings that lead with A/B Testing rarely also ask for PyTorch; postings that ask for PyTorch rarely also ask for A/B Testing. Choosing which stack to interview for is the most important upstream decision a candidate can make.
Who's Hiring at Which Seniority Level?
We tagged each posting's seniority based on title keywords (Senior, Lead, Principal, Junior, Intern). Postings with no explicit signal default to mid-level.
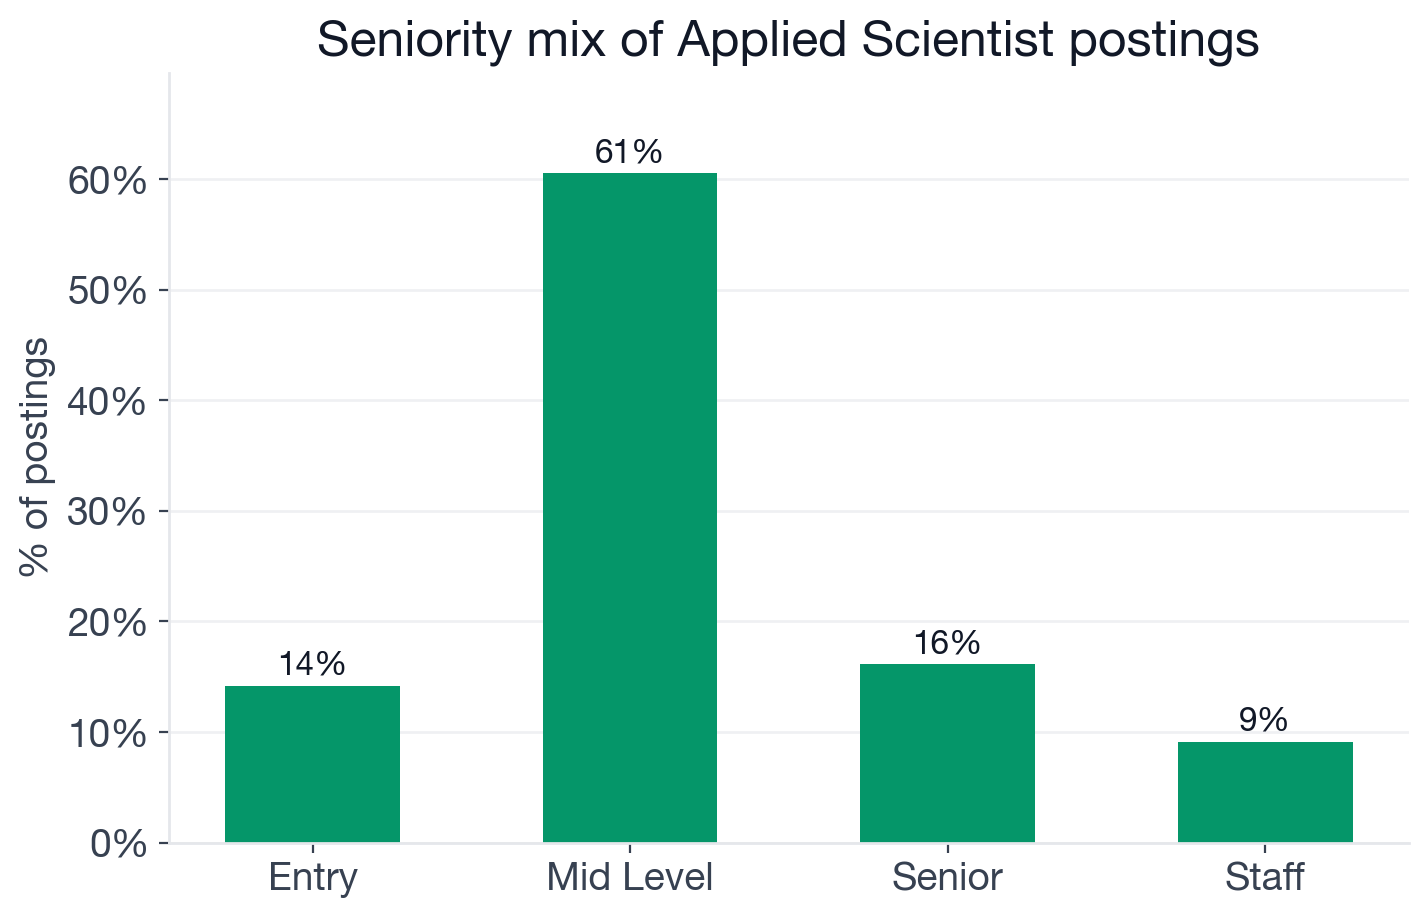
Seniority distribution of Applied Scientist postings.
- Mid-level: 60.6% (1,905 postings)
- Senior: 16.1% (508) (senior Applied Scientist openings)
- Entry: 14.2% (446) (entry-level Applied Scientist openings)
- Staff / Lead / Principal: 9.1% (287)
Two things stand out. First, the entry-level door is much wider here than for adjacent roles. 14.2% of Applied Scientist postings are explicitly entry-level, compared with 3% for Data Engineer and roughly 8% for Data Analyst. The reason is the academia and healthcare share of the employer mix: universities and research hospitals routinely hire entry-level scientists with newly minted PhDs (or, increasingly, master's degrees in statistics, biostatistics, or applied math). If you are a PhD student or postdoc looking for a first industry role, Applied Scientist is one of the more open entry points in the role family.
Second, the senior-and-above slice (senior plus staff) is 25.3% of the market, lighter than Data Engineer (45%) and AI Engineer (40%). The IC ladder in research-flavored Applied Scientist roles is real but narrower; longer-term career growth often routes through Principal Investigator, ML Manager, or Research Director titles rather than Staff-IC tracks.
Where Are Applied Scientist Jobs Located, and How Remote-Friendly Are They?
Geography is the most US-concentrated of any data-and-analytics role we have analyzed. The US share is over 60%, with no other country breaking 7%.
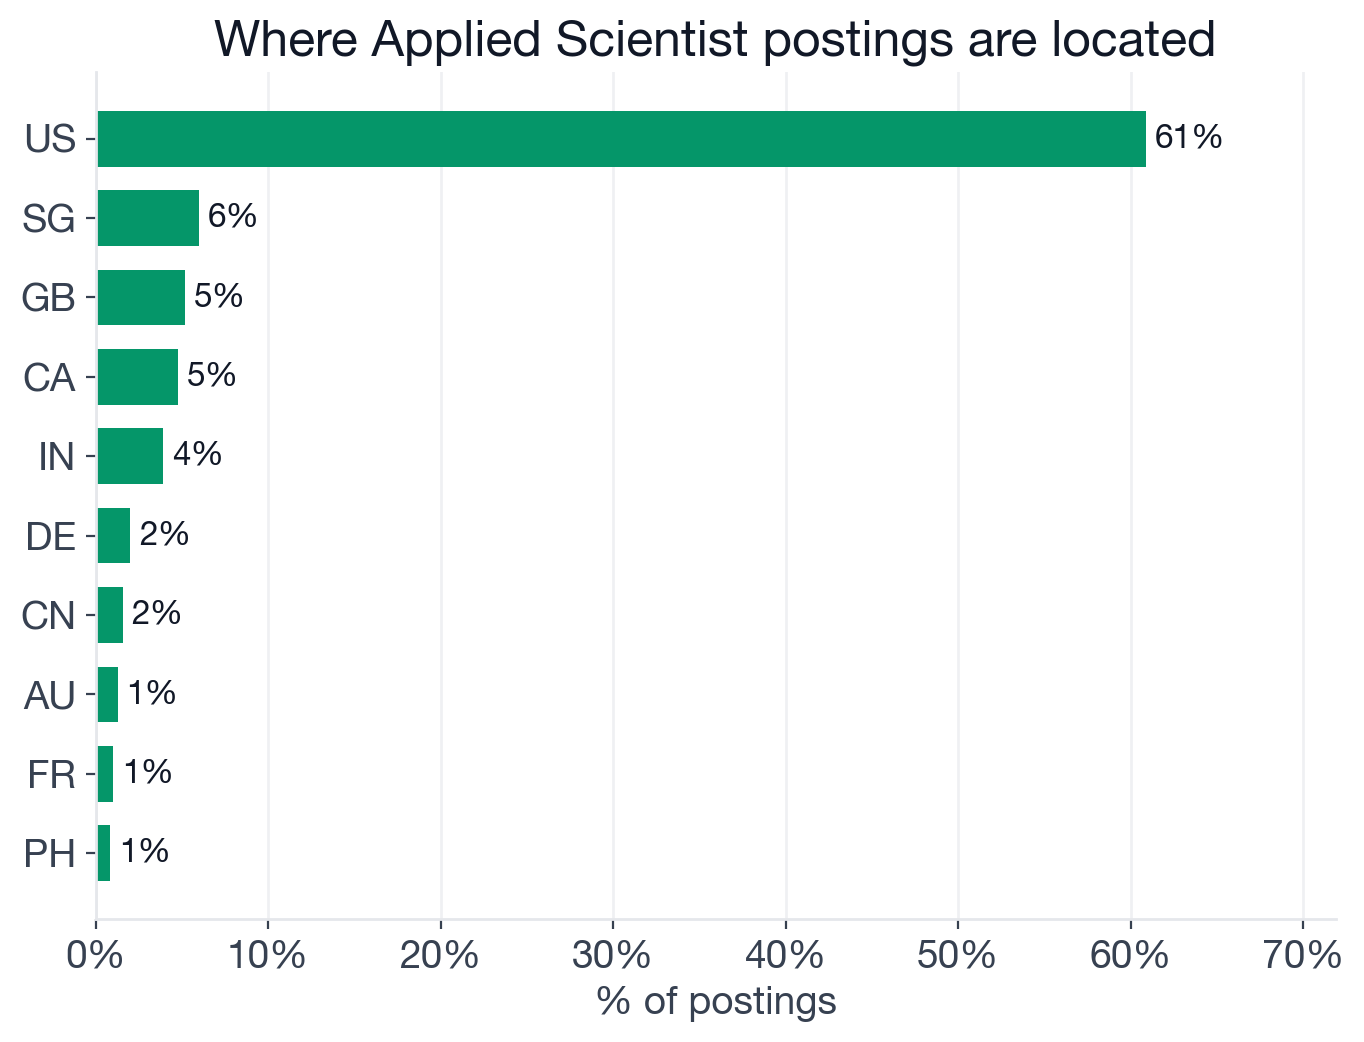
Top countries by share of Applied Scientist postings.
- United States: 60.9% (1,916) (US-only Applied Scientist openings)
- Singapore: 6.0% (188)
- United Kingdom: 5.2% (163)
- Canada: 4.8% (150)
- India: 3.9% (123)
- Germany: 2.0% (63)
- China: 1.6% (50)
- Australia: 1.3% (40)
Two of those numbers are unusual. Singapore at 6.0% is the second-largest single market for Applied Scientists, driven primarily by Nanyang Technological University's heavy posting volume in this role family. India at 3.9% is much lower than for Data Engineer (where India is 23%), because the global consulting-and-services firms that drive India's Data Engineer demand don't hire as many Applied Scientists; the work is concentrated at university research labs and pharma R&D centers, which are based in the US and Western Europe.
Work mode reinforces the same pattern.
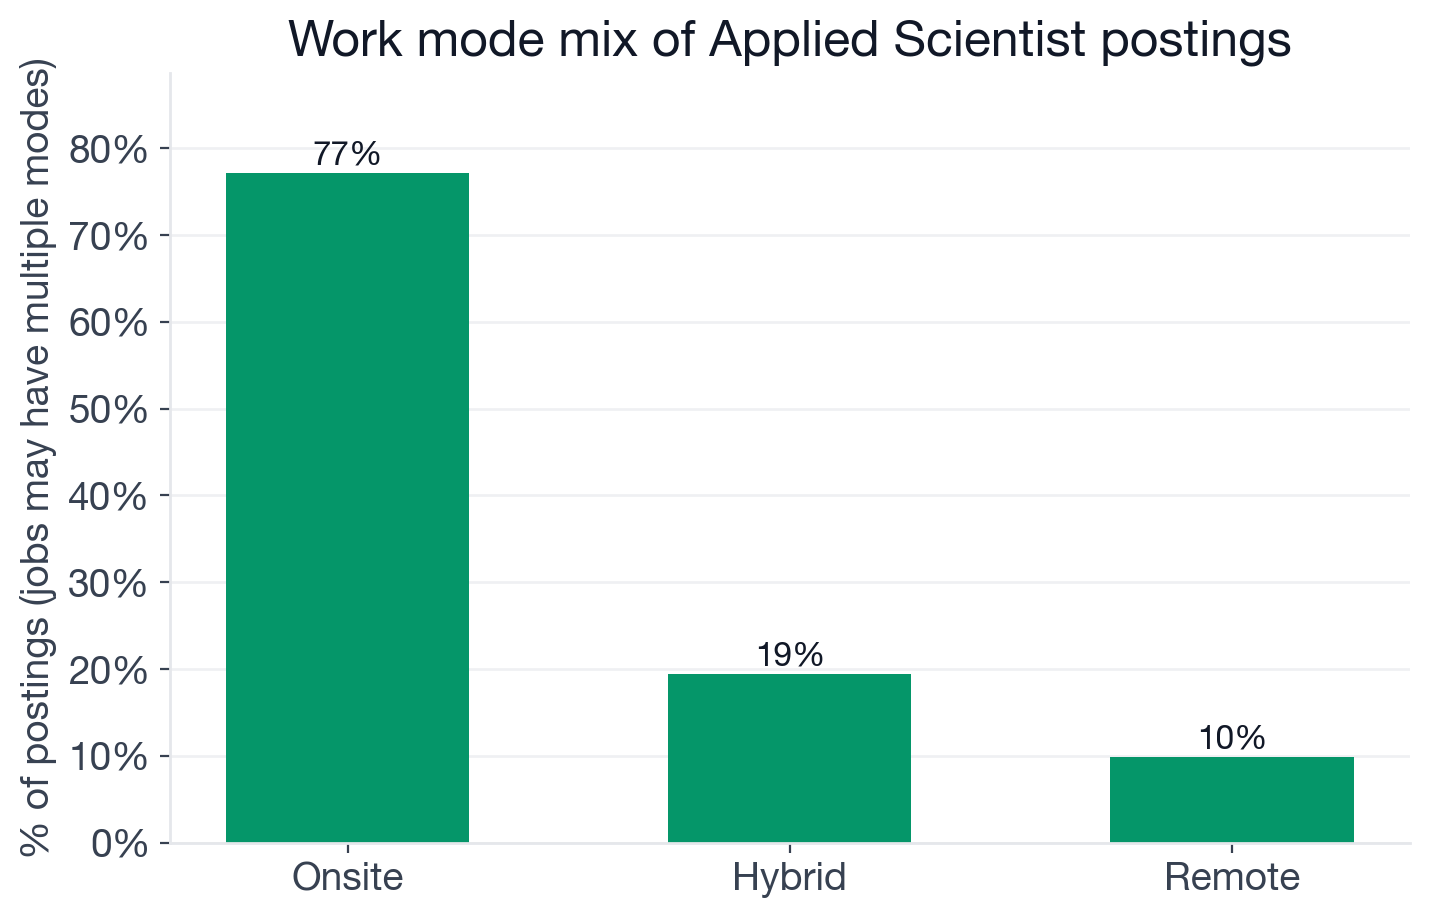
Share of Applied Scientist postings tagged with each work mode. Some postings carry multiple tags, so percentages sum to more than 100%.
- Onsite: 77.1% of postings (2,427)
- Hybrid: 19.4% (611)
- Remote: 9.9% (310) (fully-remote Applied Scientist openings)
77% onsite is the highest onsite share of any role we have analyzed; for context, Data Engineer is ~50% onsite and Data Analyst is ~56%. The cause is the employer mix: universities, hospitals, pharma R&D, and government labs almost never post remote scientist roles. They want the work happening in their facilities, often because the data is sensitive, the equipment is physical, or the IRB protocols require it. The fully remote slice exists, but it concentrates in product-led tech companies (Adobe and a small handful of others on this list), not in the academic-and-pharma majority.
Who's Hiring Applied Scientists in 2026?
The list of top hiring employers is one of the most informative single signals in this dataset. It looks almost nothing like the top employers for Data Engineer or AI Engineer.
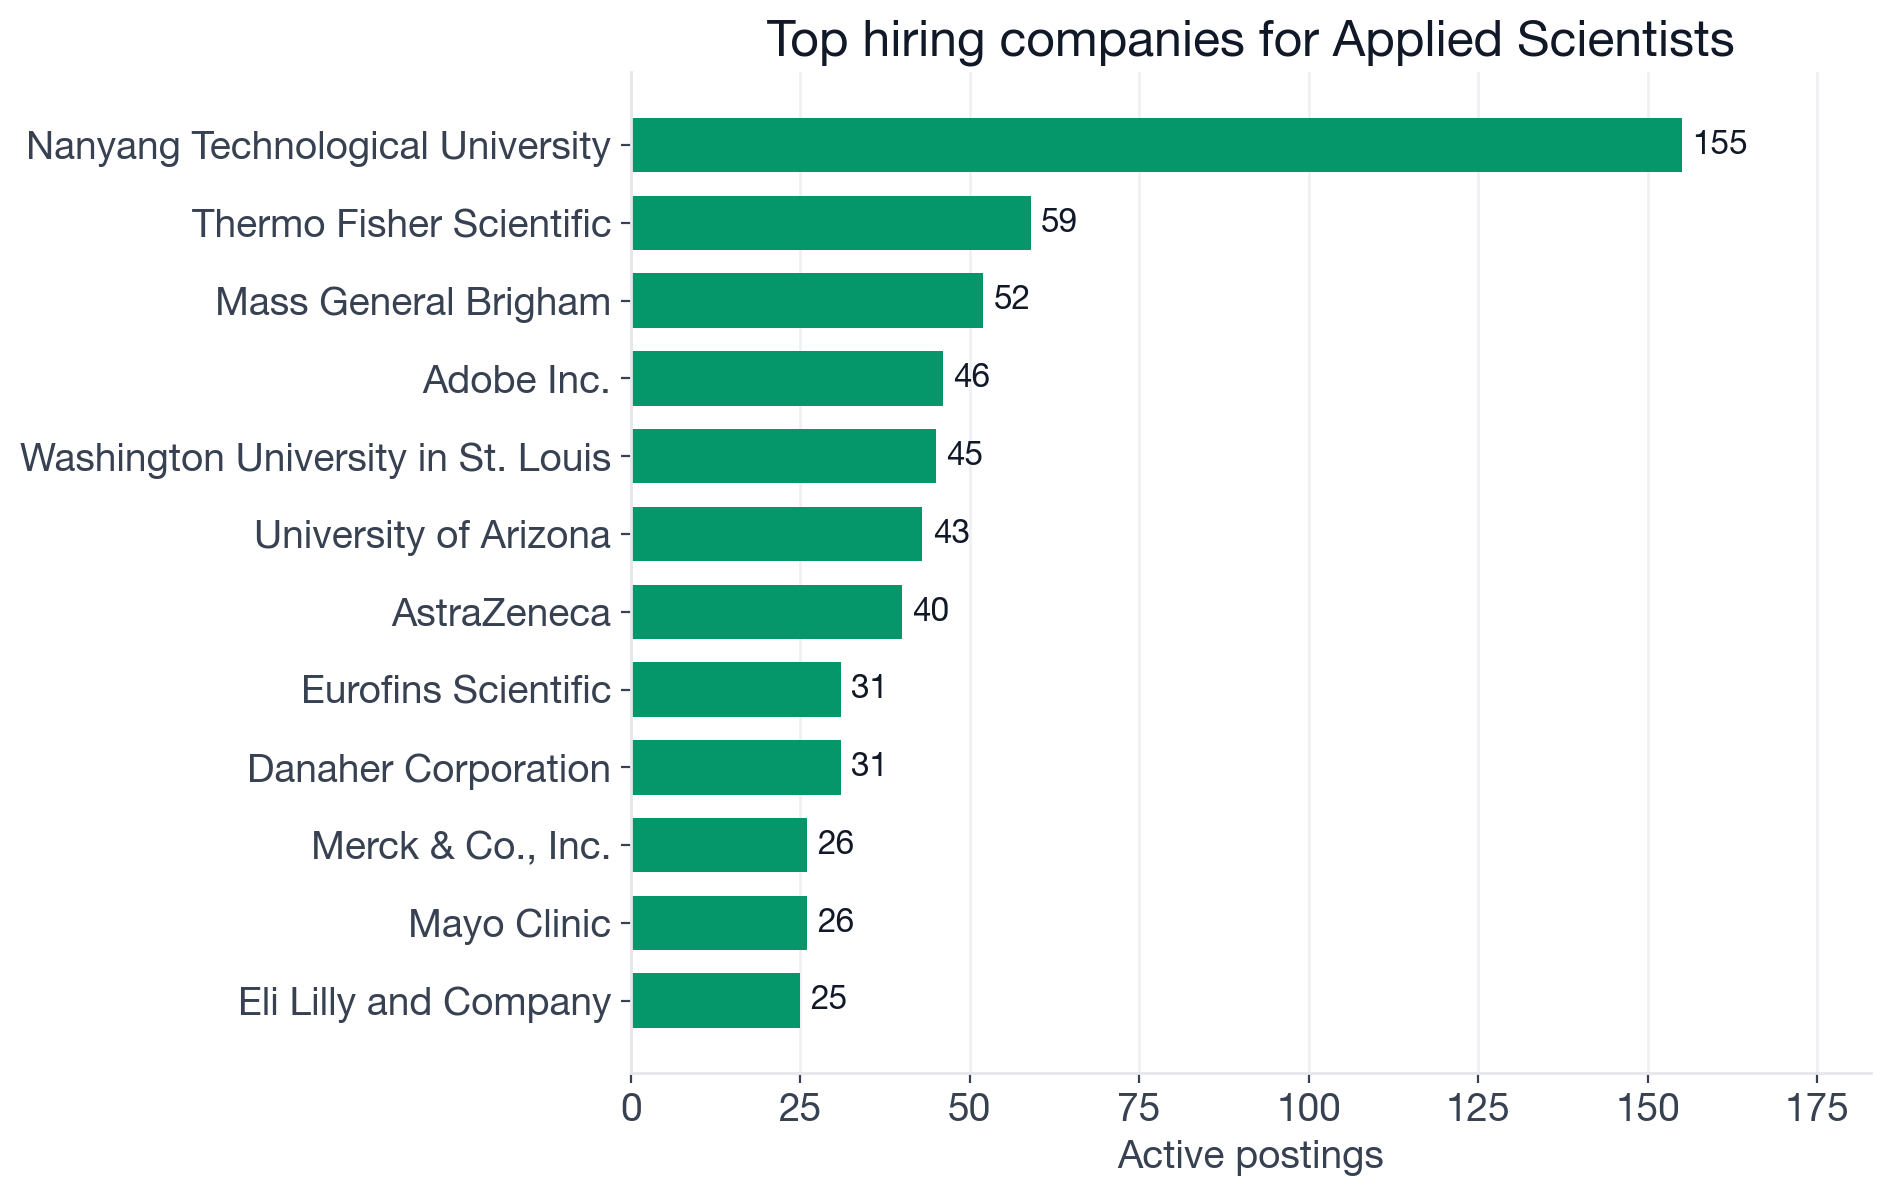
Top companies by active Applied Scientist postings. Counts include all locations of the same job.
- Nanyang Technological University: 155 postings (research university)
- Thermo Fisher Scientific: 59 (life-sciences instruments and services)
- Mass General Brigham: 52 (academic medical center)
- Adobe Inc.: 46 (consumer software)
- Washington University in St. Louis: 45 (research university)
- University of Arizona: 43 (research university)
- AstraZeneca: 40 (pharmaceutical)
- Eurofins Scientific: 31 (lab testing and life sciences)
- Danaher Corporation: 31 (life-sciences and diagnostics conglomerate)
- Merck & Co., Inc.: 26 (pharmaceutical)
- Mayo Clinic: 26 (academic medical center)
- Eli Lilly and Company: 25 (pharmaceutical)
The top 12 employers are dominated by research universities (Nanyang, Washington University, University of Arizona, plus several more outside the top 12), academic medical centers (Mass General, Mayo Clinic, Cleveland Clinic), pharmaceutical firms (AstraZeneca, Merck, Eli Lilly, Amgen), and life-sciences companies (Thermo Fisher, Danaher, Eurofins). Adobe is the only consumer-tech name in the top tier. The Big-Tech Applied Scientist roles that dominate the role's reputation (at Amazon, Microsoft, Meta) exist on the board but are spread across many smaller per-company posting counts, so they do not surface in the top-12 list.
If you are interviewing for an Applied Scientist role in 2026, the practical implication is this: the modal employer is a research university, hospital, or pharma R&D group, not a Big-Tech ML team. Tailor your resume, your research statement, and your interview prep accordingly. Our interview preparation guides cover the technical and behavioral rounds at the specific companies above.
How to Use This in Your Job Search
If you are preparing for an Applied Scientist job hunt, the data points to a clear sequence.
1. Pick a flavor of the role before applying. Applied Scientist is two roles inside one keyword: the product-science version (experimentation, A/B testing, statistics, Python) and the model-building version (Machine Learning, Deep Learning, PyTorch, increasingly LLMs and Generative AI). The skills, employer types, salary distributions, and interview formats are different. A resume that tries to be both reads as expert in neither. Decide which version you are targeting and concentrate your prep there.
2. Build the matching foundation. For the product-science flavor, the foundation is Python plus Statistics plus A/B Testing methodology: confidence intervals, hypothesis testing, multiple-comparison correction, causal-inference patterns. For the model-building flavor, the foundation is Python plus PyTorch plus the math behind modern deep learning (linear algebra, optimization, attention mechanisms). The salary data shows the model-building track pays roughly $28K to $35K more in median US base, but it has a steeper technical entry bar and a tighter employer set.
3. Add the differentiator your target stack values. For product-science, add forecasting (+$10K), Bayesian methods, or a strong causal-inference toolkit. For model-building, add a current modern-AI specialty: LLMs ($139,600), Generative AI ($140,000), or distributed training. Cloud fluency (AWS at $128,000, Google Cloud at $124,500) lifts both stacks roughly $14K to $18K above the role baseline.
4. Drill the topics, then practice the rounds. Reading about Applied Scientist skills is easy; performing under interview conditions is the hard part. Our interview-prep courses cover the foundations across statistics, ML, system design, and SQL. The question bank lets you drill statistics, A/B testing, machine learning, and deep-learning topics one at a time. AI mock interviews let you practice the full round under realistic conditions, with on-demand feedback on case studies, experimental design, and ML system design.
5. Filter the job board for your flavor. Browse current Applied Scientist openings on the InterviewStack.io job board and combine role and skill filters to narrow to the version you want, e.g., Applied Scientist + Statistics for the experimentation track or Applied Scientist + PyTorch for the deep-learning track. The board updates daily, so the listings are current.
FAQ
Q. What skills do companies want for Applied Scientist roles in 2026?
No single skill clears a majority of postings. The most-requested individual skill, A/B Testing, appears in 26.3% of listings, followed by Python (25.4%) and Statistics (24.6%). At the family level, Statistics & Experimentation leads at 44.6%, followed by Coding Languages (28.3%) and Machine Learning & AI (19.3%). Differentiators like Machine Learning (15.3%), PyTorch (5.4%), and Deep Learning (5.6%) pay the largest salary premiums.
Q. What is the median Applied Scientist salary in 2026?
The median US base salary across 878 Applied Scientist postings with disclosed US salary is $110,000. That figure excludes equity, bonuses, and sign-on, so total compensation at top employers runs meaningfully higher. Postings that ask for PyTorch, Deep Learning, LLMs, or Generative AI cluster around $139K to $145K, roughly $30K to $35K above the role baseline.
Q. Which Applied Scientist skills pay the highest premium over the role baseline?
Among US postings, C++ and the deep-learning/modern-AI stack pay the most. C++ ($145,900, n=25), PyTorch ($145,300, n=62), and Deep Learning ($145,300, n=60) top the list, followed by Data Pipelines ($140,000, n=29), Generative AI ($140,000, n=51), and LLMs ($139,600, n=62), each sitting roughly $30K to $36K above the $110,000 role baseline. Machine Learning ($138,600, n=169) and AWS ($128,000, n=49) follow at $19K to $29K premiums.
Q. Is Applied Scientist a good entry-level role to break into?
It is more accessible than several adjacent roles. 14.2% of Applied Scientist postings are explicitly entry-level (446 of 3,146), well above the 3% entry share for Data Engineer. Mid-level postings dominate at 60.6%, and senior plus staff together are 25.3% of the market.
Q. Where are Applied Scientist jobs located, and how remote-friendly are they?
The United States is by far the largest market at 60.9% of postings (1,916 of 3,146). The next-largest single markets are Singapore (6.0%), the United Kingdom (5.2%), Canada (4.8%), and India (3.9%). Work mode is heavily onsite at 77.1% of postings, with 19.4% hybrid and just 9.9% remote. Many top employers are universities, hospitals, and pharma R&D centers, which rarely post remote scientist roles.
Q. Which companies hire the most Applied Scientists in 2026?
Nanyang Technological University leads with 155 active postings, followed by Thermo Fisher Scientific (59), Mass General Brigham (52), Adobe (46), Washington University in St. Louis (45), University of Arizona (43), AstraZeneca (40), Eurofins Scientific (31), Danaher (31), Merck (26), Mayo Clinic (26), and Eli Lilly (25). The top of the list is dominated by universities, hospitals, and life-sciences companies rather than Big Tech.
Q. What is the dominant Applied Scientist skill stack in 2026?
Two stacks coexist in the data. The broad analytical stack is Python plus Statistics, which appear together in 369 postings (11.7% of the market, lift 1.87), often with A/B Testing as a third leg. The deep-learning specialty stack is Machine Learning plus Python (350 postings, lift 2.86) with a tight PyTorch plus Deep Learning sub-pair (95 postings, lift 10.11). The split reflects two distinct flavors of the role: experimentation-heavy product science and model-building research.
Final Thoughts
The Applied Scientist role in 2026 is the most fragmented title in the data-and-analytics family. No single skill carries the role, no single industry dominates the employer mix, and no single salary band describes the comp range. What does carry the role is the deliberate choice of which flavor to interview for: experimentation and statistics, or model-building and deep learning. Pick one early, build the foundation cleanly, and the differentiator that earns the salary premium will follow.
We will refresh this analysis quarterly so the trend lines stay current.
Topics
Ready to practice?
Put what you've learned into practice with AI mock interviews and structured preparation guides.