
The Business Intelligence Analyst Tableau, Power BI, and Looker Interview Turns on Grain, Not Chart Type
Picture a mid-level Business Intelligence Analyst interview where the interviewer hands you a subscription product and says leaders keep seeing different numbers for the same KPI. Your instinct is to reach for a chart type. That instinct is the trap. This walkthrough follows a real AI-interview blueprint generated by InterviewStack.io's mock-interview engine, and the scenario hides its hardest test in three warehouse tables that are quietly built at three different grains: an event-level subscriptions log, a daily user-level usage table, and a daily channel-level marketing spend table. Slice any two of them together without collapsing to a shared grain first, and you don't just get a wrong number, you get a number that looks completely reasonable while it's wrong.
Key Findings
- The rubric totals 100 points across 4 dimensions: Interviewer Objectives Alignment (30), Level-Specific Expectations (30), Technical Proficiency (20), Communication & Problem Solving (20).
- The interview runs 30 minutes across 3 phases: framing (0-7 min), data modeling (7-18 min), dashboard and governance (18-30 min).
- Phase 1 gives you just 7 minutes to clarify KPI definitions and flag grain risk, and it holds 4 separate checklist items.
- Phase 2 (7-18 min, 11 minutes) carries 5 checklist items, tied with Phase 3 for the most of any phase, all about the modeling layer.
- 3 source tables in the scenario sit at 3 different grains: subscription event, user-day, and channel-day.
- 4 skill areas are explicitly off-limits for this interview: ML model development, distributed pipeline orchestration, frontend engineering, and advanced statistical experimentation.
- This walkthrough dramatizes 4 of the interview's 6 scripted follow-up questions.
What Is the Interviewer Actually Testing With This Dashboard?
The interview question
A product and operations team at a large consumer tech company wants a weekly business review dashboard for a subscription product. Today, each team pulls numbers separately from SQL and spreadsheets, and leaders often see conflicting values for the same KPI. The dashboard needs to serve Product, Finance, and Regional Operations, answering how subscriber growth is trending, which acquisition channels drive paid conversions, where cancellations are increasing, and how results vary by country, device platform, and plan type. You can assume the underlying warehouse includes the following tables:
-- subscriptions grain: one row per subscription lifecycle event subscriptions ( subscription_id STRING, user_id STRING, event_date DATE, event_type STRING, -- 'trial_start', 'paid_start', 'renewal', 'cancel' country STRING, device_platform STRING, plan_type STRING, acquisition_channel STRING, revenue_usd NUMERIC )-- daily active users by product usage product_usage_daily ( activity_date DATE, user_id STRING, country STRING, device_platform STRING, sessions INT, minutes_watched INT )
-- marketing spend by day and channel marketing_spend_daily ( spend_date DATE, acquisition_channel STRING, country STRING, spend_usd NUMERIC )
The team has asked for a BI-tool-based solution, in Tableau, Power BI, or Looker, not a notebook or custom app. Using the data above, how would you design and deliver a trustworthy self-serve dashboard solution for this weekly business review?
The interviewer isn't grading chart taste. The objective behind this prompt is whether you can structure metrics consistently, pick a modeling approach that holds up under slicing, protect trust and governance as more people touch the dashboard, and reason about tool trade-offs like a practitioner instead of reciting feature lists. That's a wide net, and it's exactly why the rubric weighs how you think about the problem (Objectives Alignment, Level-Specific Expectations) more heavily than what you build (Technical Proficiency, Communication): the former pair carries 60 of the 100 points, the latter 40.
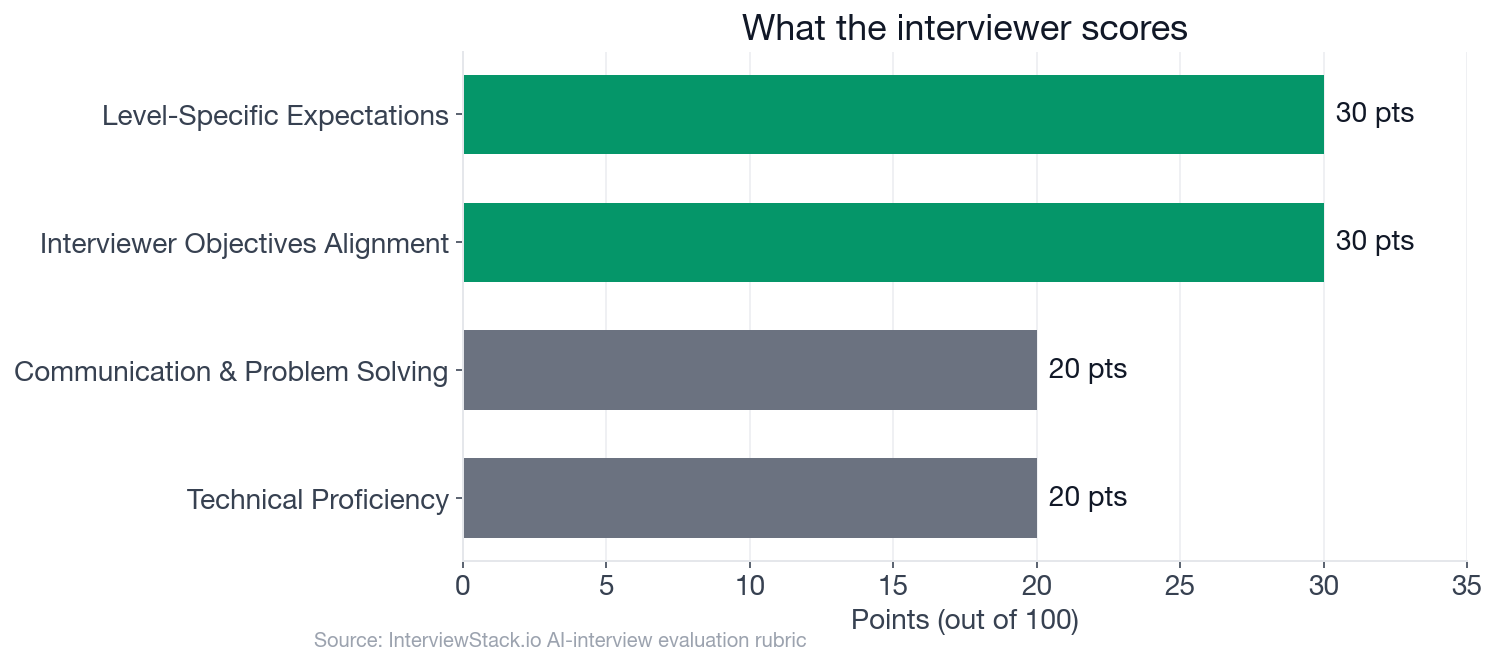 Framing and judgment outweigh raw tool mechanics: 60 of 100 points sit in Objectives Alignment and Level-Specific Expectations combined.
How Does a Strong Candidate Actually Handle This Live?
Below, a candidate we'll call Grace walks through four of the interview's follow-ups. Her first-pass answers are common ones, not failures of effort, just the instinct most mid-level candidates default to under time pressure.
Turn 1: Locking the KPI Definitions
Interviewer: "How would you define the core KPIs so Product, Finance, and Operations are all looking at the same numbers?"
Turn 2: Modeling Without the Fan-Out
Interviewer: "If stakeholders want to slice conversion from trial to paid by country, channel, and plan type, what modeling choices in the BI tool would you make to keep the logic maintainable?"
Turn 3: When the Numbers Won't Sit Still
Interviewer: "How would you handle data quality issues like late-arriving cancellation events or marketing spend that does not perfectly align to subscription events?"
Turn 4: Governance Without Reforking the Definitions
Interviewer: "How would you design permissions or governance so regional leads can explore their own data without creating conflicting KPI definitions?"
Why Doesn't Spotting the Grain Trap on the Page Fix It Live?
Reading Grace's first-pass answers, the fix in each box probably looks obvious. That's the trap of reading a walkthrough: every mistake is already labeled red, and the correction is sitting right next to it in green. In a live AI mock interview, you don't get that framing. You get one follow-up at a time, no signal about which of your last three sentences the interviewer is about to probe, and a clock that doesn't pause while you reconsider whether your slicing plan actually holds up across three different table grains. Recognizing a grain mismatch in hindsight and catching it in the first 30 seconds of a live follow-up are different skills, and only one of them earns points.
The Complete Blueprint for a Trustworthy BI Answer
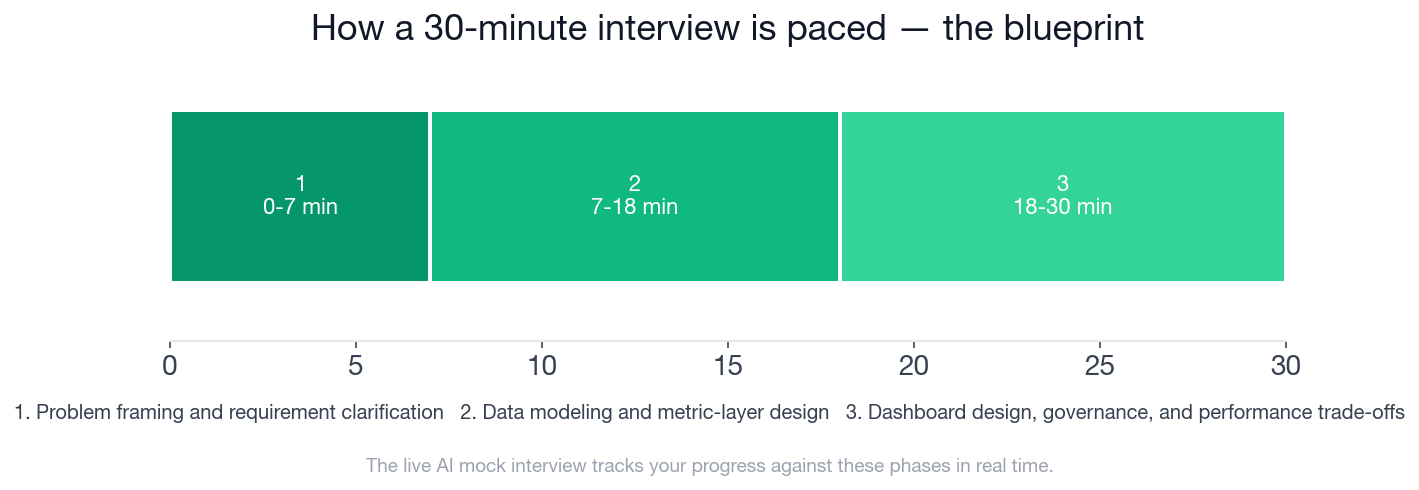 A strong 30-minute answer moves from KPI framing (0-7 min) to modeling (7-18 min) to dashboard, governance, and performance (18-30 min), never doubling back to redefine a metric mid-build.
This is the full blueprint a strong candidate hits phase by phase, and it's the exact structure InterviewStack.io's AI interviewer tracks you against in real time, checking off each item as you cover it rather than scoring you only at the end.
- ✓Asks who the primary decision-makers are and how the dashboard will be used in weekly review versus ad hoc exploration
- ✓Clarifies at least some core KPI definitions such as what counts as subscriber growth, paid conversion, and cancellation
- ✓Recognizes that the tables are at different grains and calls out risk of incorrect joins or double counting
- ✓States an initial plan to centralize business logic rather than embedding inconsistent calculations in many visuals
- ✓Proposes a coherent model, such as curated fact tables or derived views for subscription events, usage, and marketing spend with conformed dimensions like date, country, platform, plan, and channel
- ✓Explains how to compute at least a few key measures without obvious grain errors, such as paid starts, cancels, net adds, conversion rate, or spend-based metrics
- ✓Distinguishes when to use BI-tool calculations versus upstream SQL transformations for reusability and correctness
- ✓Mentions validation against source queries or existing reports before rollout
- ✓Shows awareness of platform-specific patterns such as Looker explores and measures, Power BI star schema and DAX measures, or Tableau published data sources and calculated fields
- ✓Describes a dashboard structure with top-line KPI summary plus drillable breakdowns by geography, channel, platform, and plan
- ✓Explains how filters and interactions should work without causing confusion or misleading comparisons
- ✓Identifies at least one performance strategy such as extracts, aggregations, incremental refresh, aggregate awareness, precomputed tables, or limiting high-cardinality interactions
- ✓Addresses governance with shared definitions, certified datasets, or semantic-layer ownership and some form of permissioning
- ✓Makes sensible comments about cross-tool delivery and which logic should be standardized upstream to avoid divergence
Turn This Walkthrough Into Practice
Reading the four turns above is worth something, but it isn't the same as producing a KPI definition, a grain-safe model, and a governance plan out loud, in order, in under 30 minutes, while an interviewer decides what to ask next based on what you just said. That's what the AI mock interview on Tableau, Power BI, and Looker fundamentals gives you: the same phased rubric, live follow-ups, and turn-by-turn feedback against the blueprint above.
If you want to warm up on individual pieces first, before running the phased scenario, the BI Tools question bank breaks the same topics into focused, standalone questions. For foundational modeling concepts across platforms, InterviewStack.io's interactive courses cover BI and analytics fundamentals if you want to shore up the semantic-layer thinking before your next interview. And the preparation guides cover how BI Analyst interviews run at a range of companies, if you want the broader context before you sit a live one.
FAQ
Q. What does a Business Intelligence Analyst interview on Tableau, Power BI, and Looker actually test?
It tests whether you can design and operationalize a maintainable self-serve BI solution for a realistic business scenario: structuring metrics, choosing a modeling or semantic layer, handling trust and governance, designing a usable dashboard, and reasoning about trade-offs across Tableau, Power BI, and Looker. For a mid-level candidate (2-5 years), this is scored across 4 rubric dimensions worth 100 points total.
Q. How long is this BI Analyst mock interview and how is it paced?
30 minutes across 3 phases: problem framing and requirement clarification (0-7 minutes), data modeling and metric-layer design (7-18 minutes), and dashboard design, governance, and performance trade-offs (18-30 minutes).
Q. Why do three warehouse tables at different grains matter so much in this interview?
The scenario's subscriptions table is at an event-lifecycle grain, product_usage_daily is at a user-per-day grain, and marketing_spend_daily is at a channel-per-day grain. Joining or slicing them without collapsing to a consistent grain first is the single fastest way to double-count a metric, which is exactly why Phase 1's checklist explicitly rewards calling out that risk before any modeling starts.
Q. What's the most common mistake candidates make when slicing conversion rates by country, channel, and plan type?
Filtering and aggregating directly against the raw event log inside the BI tool, per dashboard, instead of first collapsing the events into one clean row per subscription state in a shared model. That produces a fan-out the moment more than one dimension is added, and it fails the checklist item on computing measures without obvious grain errors.
Q. Do I need to be an expert in Tableau, Power BI, and Looker to pass this interview?
No. The rubric explicitly expects you to describe maintainable calculated fields and dashboard interactions in at least one major BI tool, with comparative awareness of the other two, not deep fluency in all three.
Q. How does governance get evaluated in this interview?
Through whether you pair access control with a single, centrally owned set of metric definitions. Row-level security alone is not enough; the checklist rewards catching that regional leads exploring their own data can still redefine a KPI unless the core measures are certified and locked in one semantic layer.
Q. How can I practice this exact interview scenario?
Start a free AI mock interview on Tableau, Power BI, and Looker fundamentals, which runs the same phased rubric and gives you turn-by-turn feedback, or drill individual questions first in the question bank.
One Number Beats Six Explanations
Every team in this scenario can already produce a number. What they can't do is agree on which one is right, and that's the entire job description hiding inside a dashboard request. Get the KPI definitions, the grain, the validation, and the governance right in that order, and the dashboard needs no footnotes. Get any one of them wrong, and you'll spend the next quarter explaining why Finance's number and Product's number disagree.
Topics
Ready to practice?
Put what you've learned into practice with AI mock interviews and structured preparation guides.