
The Dashboard Had 14 Tiles and Zero Answers
Picture a mid-level Data Analyst interview where you are asked to design a monthly business review dashboard for a subscription product. A prepared candidate, Marcus, lists every chart in the toolbox. The interviewer is not counting charts. They are waiting to hear which decision each one supports, and Marcus never says.
Key Findings
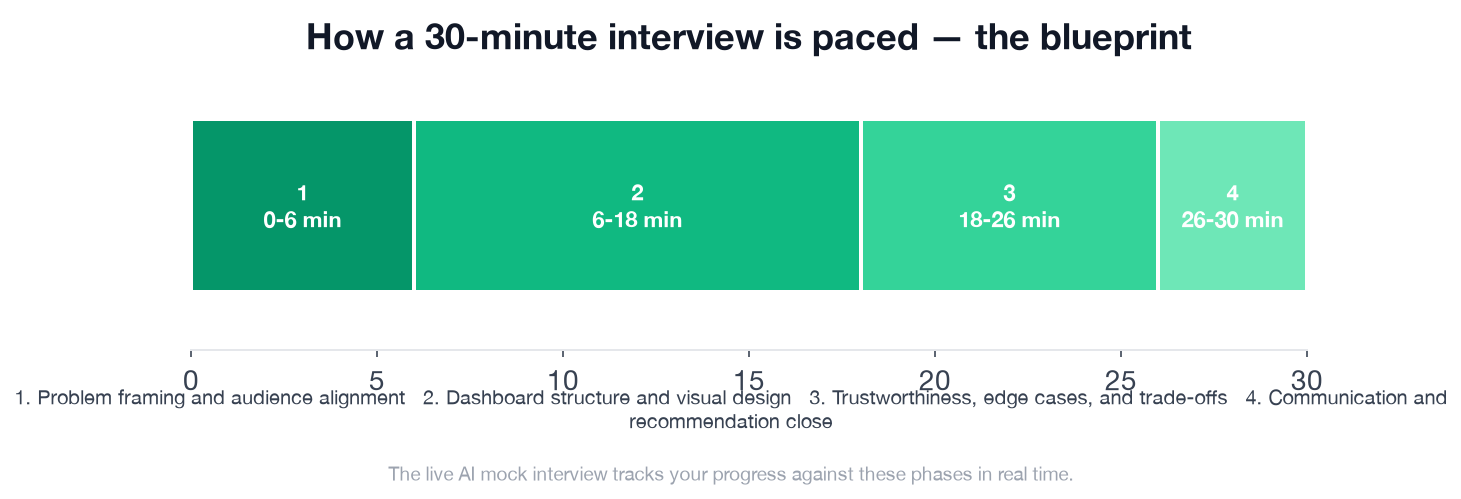
- The mock interview runs 30 minutes in 4 phases: 0-6, 6-18, 18-26, and 26-30 minutes.
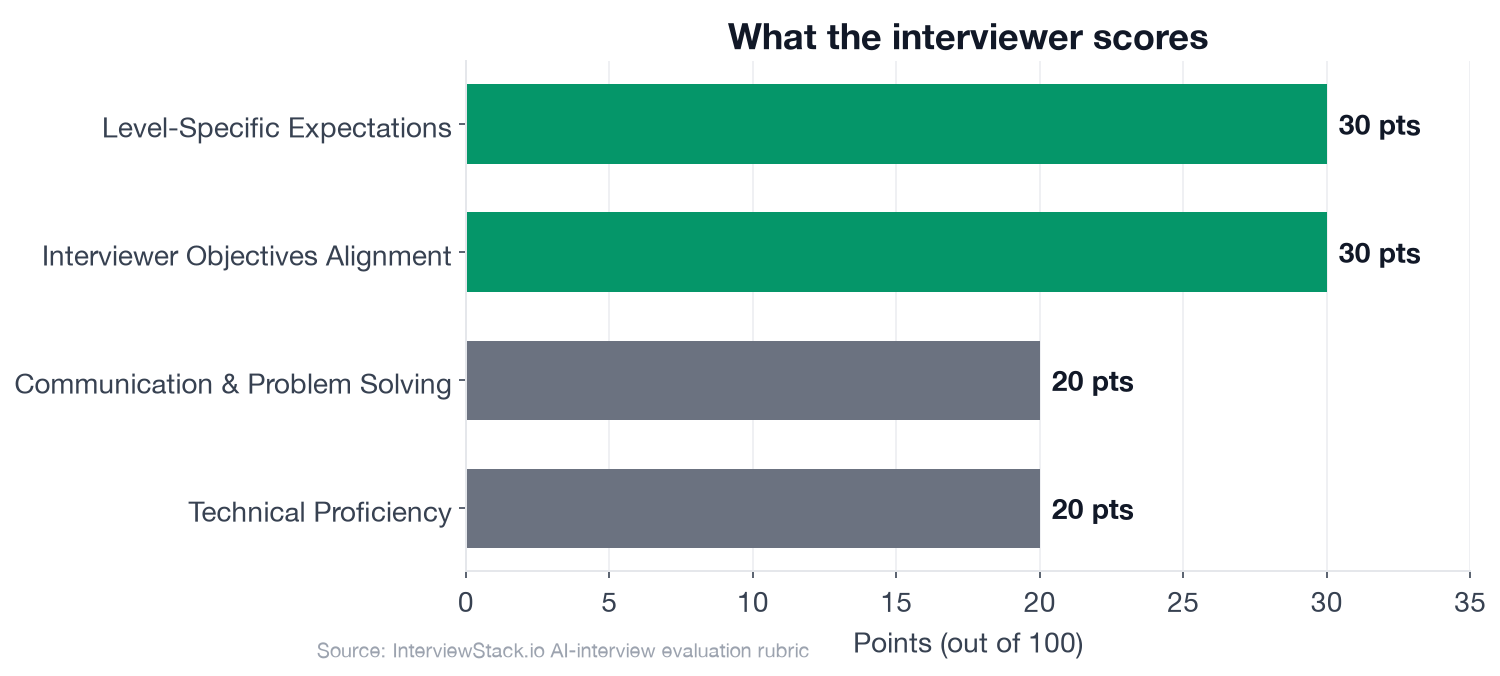
- The rubric totals 100 points; Technical Proficiency is only 20 of them.
- Objectives Alignment (30) plus Level-Specific Expectations (30) carry 60 points, so those two together are worth three times Technical Proficiency's 20.
- The structure phase is the longest at 12 minutes and holds 5 checklist items, the most of any phase.
- The scenario serves 3 audiences: a Director of Product, a Growth Manager, and regional operations leads.
- The interview scope excludes 4 topics, including SQL queries and pipelines, so every minute is design talk.
What Does the Interviewer Actually Ask?
The setup is a recurring review, not a one-off slide, so your answer has to survive being opened every month by people with different jobs.
The interview question
You are supporting a monthly business review for a consumer subscription product at a large tech company. Leadership wants a dashboard to understand recent changes in acquisition, conversion, retention, and revenue across web and mobile. It will be used by a Director of Product, a Growth Manager, and regional operations leads, in recurring review meetings rather than as a one-off slide.
Assume the underlying metrics and data pipelines are already trustworthy. Your task is to design the dashboard experience, not to write queries.
How would you design this dashboard so that these stakeholders can quickly understand performance, spot issues, and decide what action to take?
What Is the Interviewer Really Probing?
Four things: whether you start from decisions and audience, whether your hierarchy makes trend, comparison, and segmentation easy to read, whether you protect the viewer from misleading visuals, and whether you can state trade-offs, including what you would exclude. At mid-level, they expect a coherent structure with little prompting. Reporting completeness is not the goal; actionability is.
The Walkthrough, Turn by Turn
The answers below are illustrative patterns, not transcripts of real candidates.
Turn 1: Two Audiences, One Page
Interviewer: "If the Director wants a very high-level summary but the Growth Manager needs channel-level diagnosis, how would you handle both audiences without making the dashboard cluttered?"
Turn 2: Find the Android Dip
Interviewer: "Suppose conversion is down overall, but only for Android users in one region after a recent experiment launch. How would your design help someone discover that efficiently?"
Turn 3: How It Could Mislead
Interviewer: "What are some ways this dashboard could accidentally mislead viewers, and how would you prevent that in the design?"
Turn 4: Monthly Versus Incident
Interviewer: "If this dashboard is reviewed every month but sometimes checked daily during incidents, what would you change in the layout, comparisons, or annotations to support both cadences?"
Why Isn't Reading This Enough?
You just spotted four mistakes in a quiet moment. Live, you get 30 minutes, an interviewer who interrupts, and a follow-up you did not rehearse. Knowing that a dashboard needs a hierarchy is easy. Saying it in a structured way while being asked about Android in one region is the skill, and it only comes from reps. A mock run exposes the habit you fall back on when the clock is running.
The Complete Blueprint: What a Strong Run Hits
This is the blueprint a strong candidate hits, and the exact thing the AI mock interview tracks you against in real time. Notice the 4 minutes at the end reserved for a structured recommendation, the part most people run out of time for.
- ✓Asks or states assumptions about primary audience, review cadence, and key decisions the dashboard should enable
- ✓Distinguishes summary consumption from diagnostic exploration
- ✓Frames success as speed of comprehension and actionability, not visual polish
- ✓Identifies a manageable scope for a first version
- ✓Proposes a top-level structure such as executive summary followed by funnel, trend, and segmentation/drill-down sections
- ✓Places a limited set of high-value KPIs on the first screen and explains why each is there
- ✓Uses appropriate chart types for trends, comparisons, and composition rather than defaulting to decorative visuals
- ✓Explains how filters or drill-downs would work across platform, region, channel, or cohort without overloading the page
- ✓Addresses how a user would move from 'something changed' to 'where exactly is the issue'
- ✓Calls out risks such as inconsistent time windows, truncated axes, misleading stacked areas, too many colors, or ambiguous conversion definitions
- ✓Describes comparison logic such as period-over-period, target, baseline, or annotation of launches/incidents
- ✓Explains what they would exclude from the dashboard to preserve focus
- ✓Shows a practical approach to serving both monthly review and incident-style checks
- ✓Summarizes the proposed dashboard in a structured way
- ✓Reinforces the primary audience and decisions supported
- ✓States the most important design principles or trade-offs succinctly
Run It Live Before It Counts
Start the AI mock interview for this exact scenario. You get the 30-minute pacing, the follow-ups you cannot predict, and feedback scored against the 100-point rubric above. When you want more reps on the same topic, the Data Analyst question bank on dashboard and visualization design has practice questions, and the Data Analyst job board shows the roles you are preparing for. Our preparation guides cover the wider interview loop.
FAQ
What does a mid-level Data Analyst dashboard design interview test?
It tests whether you design around stakeholder decisions rather than listing charts. You are expected to frame audience and cadence, structure a summary-to-drill-down hierarchy, choose honest encodings, and explain what you would leave out.
How is the AI mock interview scored?
Out of 100 points: Interviewer Objectives Alignment 30, Level-Specific Expectations 30, Technical Proficiency 20, and Communication & Problem Solving 20. Design judgment and trade-offs carry 60 of the points.
How long is the interview and how is it paced?
30 minutes in 4 phases: problem framing (0-6 minutes), dashboard structure and visual design (6-18), trustworthiness and trade-offs (18-26), and a recommendation close (26-30).
Do I need to write SQL or pick a specific BI tool?
No. The scenario assumes the metrics and pipelines are already trustworthy. Writing queries, building pipelines, and pixel-level tool details are outside this interview's scope and can pull you off the real question.
How many KPIs should the first screen have?
A small, deliberate set, each with a stated reason for being there. A common strong answer ties every tile to a decision and pushes everything else into drill-down views. Too many KPIs is a named mid-level pitfall.
How do you design one dashboard for an executive and an analyst?
Layer it. Give the executive a summary view that answers 'is something wrong?' at a glance, then provide a short path of filters and drill-downs that lets an operator find exactly where the problem is, without cluttering the first screen.
Are these the real questions a specific company asks?
No. The blueprint is illustrative of how a strong dashboard design interview runs. The dramatized answers are common patterns, not transcripts of real candidates.
One Rep Beats Another Re-Read
The gap between a dashboard you can describe and a dashboard you can defend out loud is closed in practice, not in notes. Run the mock once, note which turn made you list instead of decide, and run it again.
Topics
Ready to practice?
Put what you've learned into practice with AI mock interviews and structured preparation guides.