
The Data Scientist Conversion Funnel Optimization Interview Is Won by Distrusting Good News
A mid-level Data Scientist walks into a 30-minute interview and gets handed what sounds like a win: a food delivery app's Growth team redesigned onboarding and checkout, and the early read is that first-order conversion for newly acquired users went up. The safe move is to confirm the good news and recommend a full rollout. The interview is built to punish exactly that instinct. Android shipped the redesign before iOS, discount usage crept up alongside the lift, and checkout got slower, three separate reasons the topline number might be misleading, and the rubric rewards the candidate who goes looking for them before leadership decides whether to roll the redesign out to every future user.
What follows is a turn-by-turn walkthrough of that interview: the funnel scenario, four follow-ups a strong candidate has to survive, and the exact rubric cost when a mistake slips through. It is illustrative of how a strong Data Scientist conversion funnel interview runs, not a transcript of any single employer's real questions.
Key Findings
- Interviewer Objectives Alignment and Level-Specific Expectations each carry 30 of 100 rubric points, 60 combined, outweighing the 20 points each for Technical Proficiency and Communication and Problem Solving.
- The interview runs 30 minutes across 3 phases: framing (0-8 minutes), SQL and analytical reasoning (8-20 minutes), and diagnosis and recommendation (20-30 minutes).
- Phase 1 alone holds 5 checklist items, all gradeable before a single query gets written.
- The scenario is built from a 6-stage funnel (install, signup, menu view, add to cart, checkout start, paid order) drawn from 3 raw tables, scoped to a 14-day acquisition cohort.
- Phase 3's diagnosis and recommendation stretch packs 5 checklist items into its 10 minutes, including whether the before/after comparison is even credible.
- The package includes 6 interviewer follow-up prompts; this walkthrough dramatizes 4 of them.
- A candidate who never questions the topline lift can still satisfy the smaller Technical Proficiency dimension while losing most of the 60 points tied to framing and depth.
What Is the Interviewer Actually Testing in This Rollout Decision?
The interview question
You are supporting the Growth team for a food-delivery app. The team recently redesigned the new-user onboarding and checkout flow, and leadership wants to understand whether the first-order conversion funnel improved for newly acquired users. The core funnel is: app install, account signup, restaurant menu view, add item to cart, checkout started, first paid order. You have three tables available.
-- one row per tracked event CREATE TABLE app_events ( event_id STRING, user_id STRING, session_id STRING, event_name STRING, -- e.g. 'install', 'signup_complete', 'menu_view', 'add_to_cart', 'checkout_start', 'order_paid' event_ts TIMESTAMP, platform STRING, -- iOS, Android, Web country STRING, app_version STRING, acquisition_channel STRING );-- one row per order attempt CREATE TABLE orders ( order_id STRING, user_id STRING, created_ts TIMESTAMP, paid_ts TIMESTAMP, order_status STRING, -- created, failed_payment, canceled, paid order_amount_usd NUMERIC, delivery_fee_usd NUMERIC, discount_usd NUMERIC );
-- user acquisition data CREATE TABLE user_dim ( user_id STRING, install_ts TIMESTAMP, signup_ts TIMESTAMP, acquisition_channel STRING, campaign_id STRING, country STRING, platform STRING );
Leadership cares about users acquired in the last 14 days and wants an analysis they can use to decide whether to roll out the redesigned funnel to 100% of future users. How would you analyze whether the redesign improved the first-order conversion funnel, and what would you recommend?
The interviewer is not grading whether you can write a funnel query. They are watching whether you can define a fair, bounded population and comparison window, reason correctly through raw event data without double-counting or losing users to bad ordering, and then decide, with real evidence rather than a topline glance, whether the redesign is actually worth shipping to everyone.
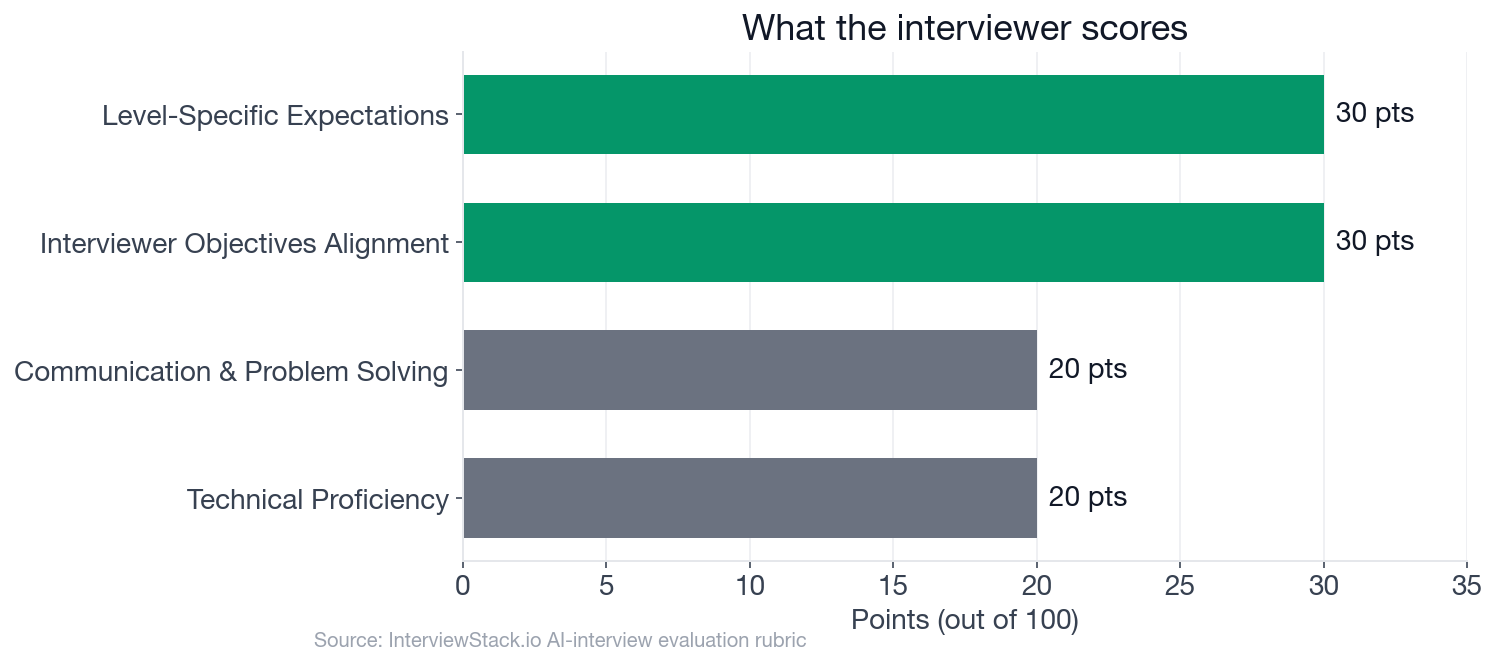
Framing and depth of reasoning outweigh raw technical execution here: Interviewer Objectives Alignment and Level-Specific Expectations each carry 30 of the 100 points, and together their 60 points more than double what Technical Proficiency alone is worth.
How Does a Data Scientist Conversion Funnel Optimization Interview Actually Run?
Four of the interviewer's six follow-ups do the most work separating a candidate who reports the good news from one who defends it.
Turn 1: Defining a fair comparison window
Interviewer: "How would you define the funnel population and conversion window so the old and redesigned experiences are compared fairly?"
Turn 2: Building the funnel table without double counting
Interviewer: "What SQL logic would you use to build a stage-by-stage funnel table from the event data while avoiding double counting users with repeated events?"
Turn 3: Is the lift actually a win?
Interviewer: "Suppose the redesign increased signup-to-order conversion but also increased discount usage and slowed checkout. How would you frame that trade-off and decide whether to roll out?"
Turn 4: Trusting a staggered rollout
Interviewer: "If the redesign was not fully randomized and launched earlier on Android than iOS, how would you make the analysis more credible?"
Why Doesn't Catching the Confound on the Page Fix It Live?
Reading these four mistakes on the page is easy. Every one of them is obvious in hindsight, laid out with the rubric cost spelled out in red. That is not the skill being measured. The actual skill is noticing a staggered rollout, a hidden discount cost, or a censored cohort while the clock is running, while the interviewer is asking unscripted follow-ups, and while your own instinct is pulling you toward reporting the good news and moving on. That gap between recognizing a mistake in review and avoiding it live only closes with repetition, which is exactly what a timed AI mock interview is built to force.
The Complete Blueprint
The chart below paces the full 30 minutes into the same three phases the interviewer is tracking against.
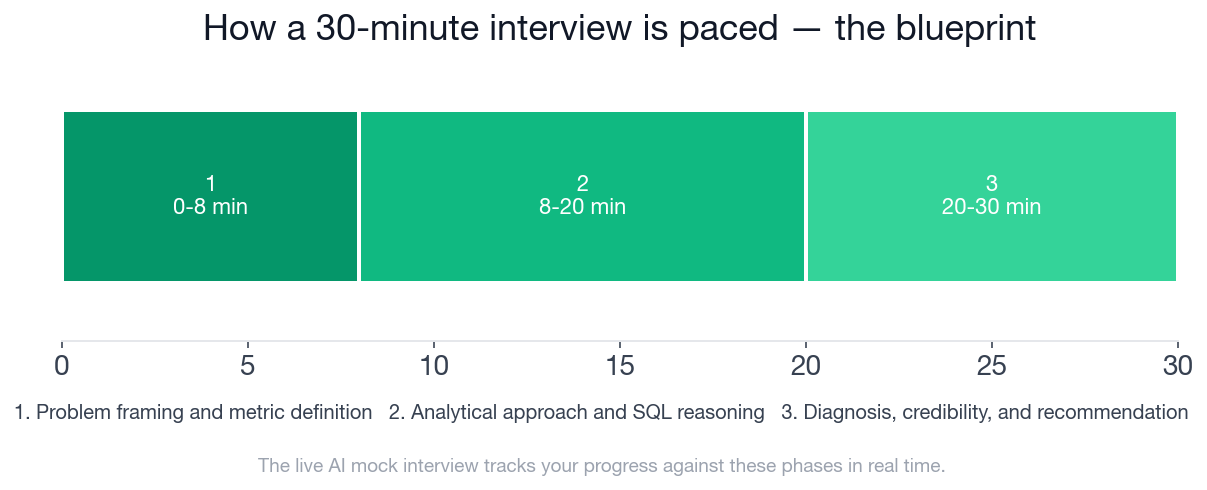
Framing gets 8 minutes, SQL and analytical reasoning gets the largest block at 12 minutes, and diagnosis, credibility, and recommendation close it out in the final 10. This is the blueprint a strong candidate hits, and it is the exact structure the AI interviewer tracks you against in real time as you talk.
- ✓States the primary KPI as first paid order conversion for newly acquired users
- ✓Defines the cohort explicitly, such as users acquired in the last 14 days and exposed to old vs redesigned flow
- ✓Chooses a bounded conversion window and explains why censoring matters for recent cohorts
- ✓Mentions both step-to-step conversion and overall install-to-paid conversion
- ✓Names at least one guardrail such as payment failure rate, checkout latency, cancellation rate, or discount cost
- ✓Explains user-level deduplication using first occurrence per stage within the analysis window
- ✓Preserves funnel order by comparing timestamps across stages rather than counting any occurrence blindly
- ✓Connects order_paid reliably, either from app_events or orders, and notes reconciliation if the two disagree
- ✓Calls out users who may skip tracked stages or have out-of-order/missing events and suggests how to quantify the impact
- ✓Proposes a concrete output shape such as counts and rates by stage, experience variant, and key segments
- ✓Distinguishes a localized stage improvement from top-of-funnel mix changes or cohort imbalance
- ✓Suggests checking significance or uncertainty around conversion differences, especially for the primary KPI
- ✓If randomization is imperfect, proposes a more credible comparison such as difference-in-differences, platform-stratified analysis, or matched cohorts
- ✓Investigates whether checkout_start to order_paid drop-off is due to payments, UX friction, or logging issues using order_status and event consistency
- ✓Ends with a recommendation tied to evidence, caveats, and a next step such as staged rollout, holdback, or instrumentation fix before rollout
Run the Same Interview, Live
Reading four dramatized mistakes is not the same as catching your own in real time, under a clock, with an interviewer who does not hand you the checklist in advance. Start a free AI mock interview on this exact Conversion Funnel Optimization scenario, get scored against this same rubric, and see turn-by-turn feedback on where you lost points and why. If you want to drill the underlying concepts first, funnel definition, SQL deduplication patterns, difference-in-differences, before you sit a full simulation, the Conversion Funnel Optimization question bank breaks the same topic into individual practice questions, and the preparation guides cover how these interviews run at a range of companies.
FAQ
Q. What makes a first-order conversion funnel bounded in a Data Scientist interview?
A bounded funnel has explicit stage ordering (install, signup, menu view, add to cart, checkout start, paid order), user-level deduplication so repeated events do not inflate a stage, and a fixed conversion window anchored to each user's acquisition timestamp rather than a shared calendar cutoff. Anchoring to acquisition matters because it prevents recently acquired users, who have not had time to convert, from being miscounted as drop-offs.
Q. How would a Data Scientist diagnose whether a drop between checkout start and paid order is a product, payment, or instrumentation issue?
Reconcile the checkout_start and order_paid events in app_events against the orders table's order_status field. A spike in failed_payment rows points to a payment issue. Users who reach checkout_start but never generate any row in orders, paid or otherwise, point to product friction or an instrumentation gap. Comparing the paid signal from app_events against paid_ts in orders also surfaces logging delays or mismatches between the two systems, which is a separate failure mode from either payments or UX.
Q. Why segment a funnel comparison by platform, country, or acquisition channel?
A topline conversion lift can be driven entirely by one segment while other segments are flat or worse. Segmenting by platform, country, and acquisition channel distinguishes a genuine broad-based improvement from a shift caused by traffic mix changes, a single high-performing channel, or, in this scenario, a staggered rollout that reached Android users before iOS users. Without the segment cut, a real localized effect can be reported as a general one.
Q. How long does a Data Scientist conversion funnel optimization interview run, and how is the time split?
This interview runs 30 minutes across three phases: problem framing and metric definition (0-8 minutes), analytical approach and SQL reasoning (8-20 minutes), and diagnosis, credibility, and recommendation (20-30 minutes). Each phase has its own checklist of five expectations the interviewer is listening for.
Q. How is a Data Scientist conversion funnel interview scored?
The 100-point rubric weighs Interviewer Objectives Alignment and Level-Specific Expectations at 30 points each, 60 points combined, with Technical Proficiency and Communication and Problem Solving each worth 20 points. Framing the problem correctly and reasoning at the expected depth carries more weight than any single calculation or query.
Q. What should a mid-level Data Scientist candidate handle independently in this interview?
A mid-level candidate is expected to structure the funnel problem, define metrics, and outline SQL steps without heavy prompting, catch common data issues like duplicate events and inconsistent event naming on their own, recommend reasonable segment cuts and guardrails, and show comfort interpreting an imperfect rollout, including basic significance and rollout-risk reasoning, without deriving formal causal proofs from first principles.
Q. Is this walkthrough based on a real company's actual interview questions?
No. This is an illustrative simulation of how a strong Data Scientist conversion funnel optimization interview runs at a mid-level bar, built from InterviewStack.io's interview blueprint for this role and topic. It does not represent any specific employer's actual interview questions.
Good News Deserves the Same Scrutiny
A conversion lift that survives a staggered rollout, a discount-cost check, and a censoring correction is worth shipping. One that only survives a glance at the topline number is not, and the interview is built to find out which one you actually did. If you found this walkthrough useful, the hypothesis testing interview walkthrough covers the same rigor applied to a different Data Scientist scenario.
Topics
Ready to practice?
Put what you've learned into practice with AI mock interviews and structured preparation guides.