
Does Excel Still Own the Financial Analyst Stack in 2026?
Ask what skills a Financial Analyst needs, and the answer starts the same place it did thirty years ago: Excel. In 2026, it still appears in 61% of all active postings. Not as one tool among many, but as the single non-negotiable entry requirement. The role has evolved around it, not away from it.
That said, the companies hiring financial analysts right now want more than spreadsheet fluency. We looked at every active Financial Analyst posting on the InterviewStack.io job board as of May 2026, 4,680 listings, with skills extracted from descriptions and synonyms collapsed. Above the Excel baseline, Forecasting appears in 43% of postings as the role's defining analytical output. And a tier of BI tools, automation skills, and ERP fluency is quietly separating the analysts who command top offers from those who don't.
The picture that emerges: a narrower table-stakes bar than engineering roles, but a meaningful differentiator premium if you know where to build.
Key Findings
- 4,680 active Financial Analyst postings analyzed across the InterviewStack.io job board as of May 2026.
- Excel is the only table-stakes skill at 60.9% (2,849 postings). No other skill clears the 50% threshold.
- Forecasting is the core common skill at 43.1% (2,018 postings), the primary analytical deliverable that separates Financial Analyst from bookkeeping roles.
- Median US base salary is $82,000 (n=1,041 postings with disclosed salary data). Top differentiator skills add up to $9,700 above that baseline.
- Only 3.1% of postings are entry-level (143 of 4,680); 60.3% are mid-level and 33.7% senior.
- The US accounts for 49.3% of all postings (2,306), making Financial Analyst one of the most US-concentrated roles on the board. Canada adds another 8.1%.
- 55.8% of postings are onsite, 28.7% hybrid, and just 10.7% fully remote.
- Explicit AI/ML requirements appear in 1.8% of postings, measuring roles built to construct AI systems. Ambient AI tool use in finance is far higher: 59% of finance functions actively deploy AI tools (Gartner, 2025).
What Skill Families Define a Financial Analyst Role in 2026?
Group individual skills into their broader families and the role's profile comes into focus. Financial Analyst is, above all else, a Spreadsheets job and a forecasting job. Everything else is secondary.
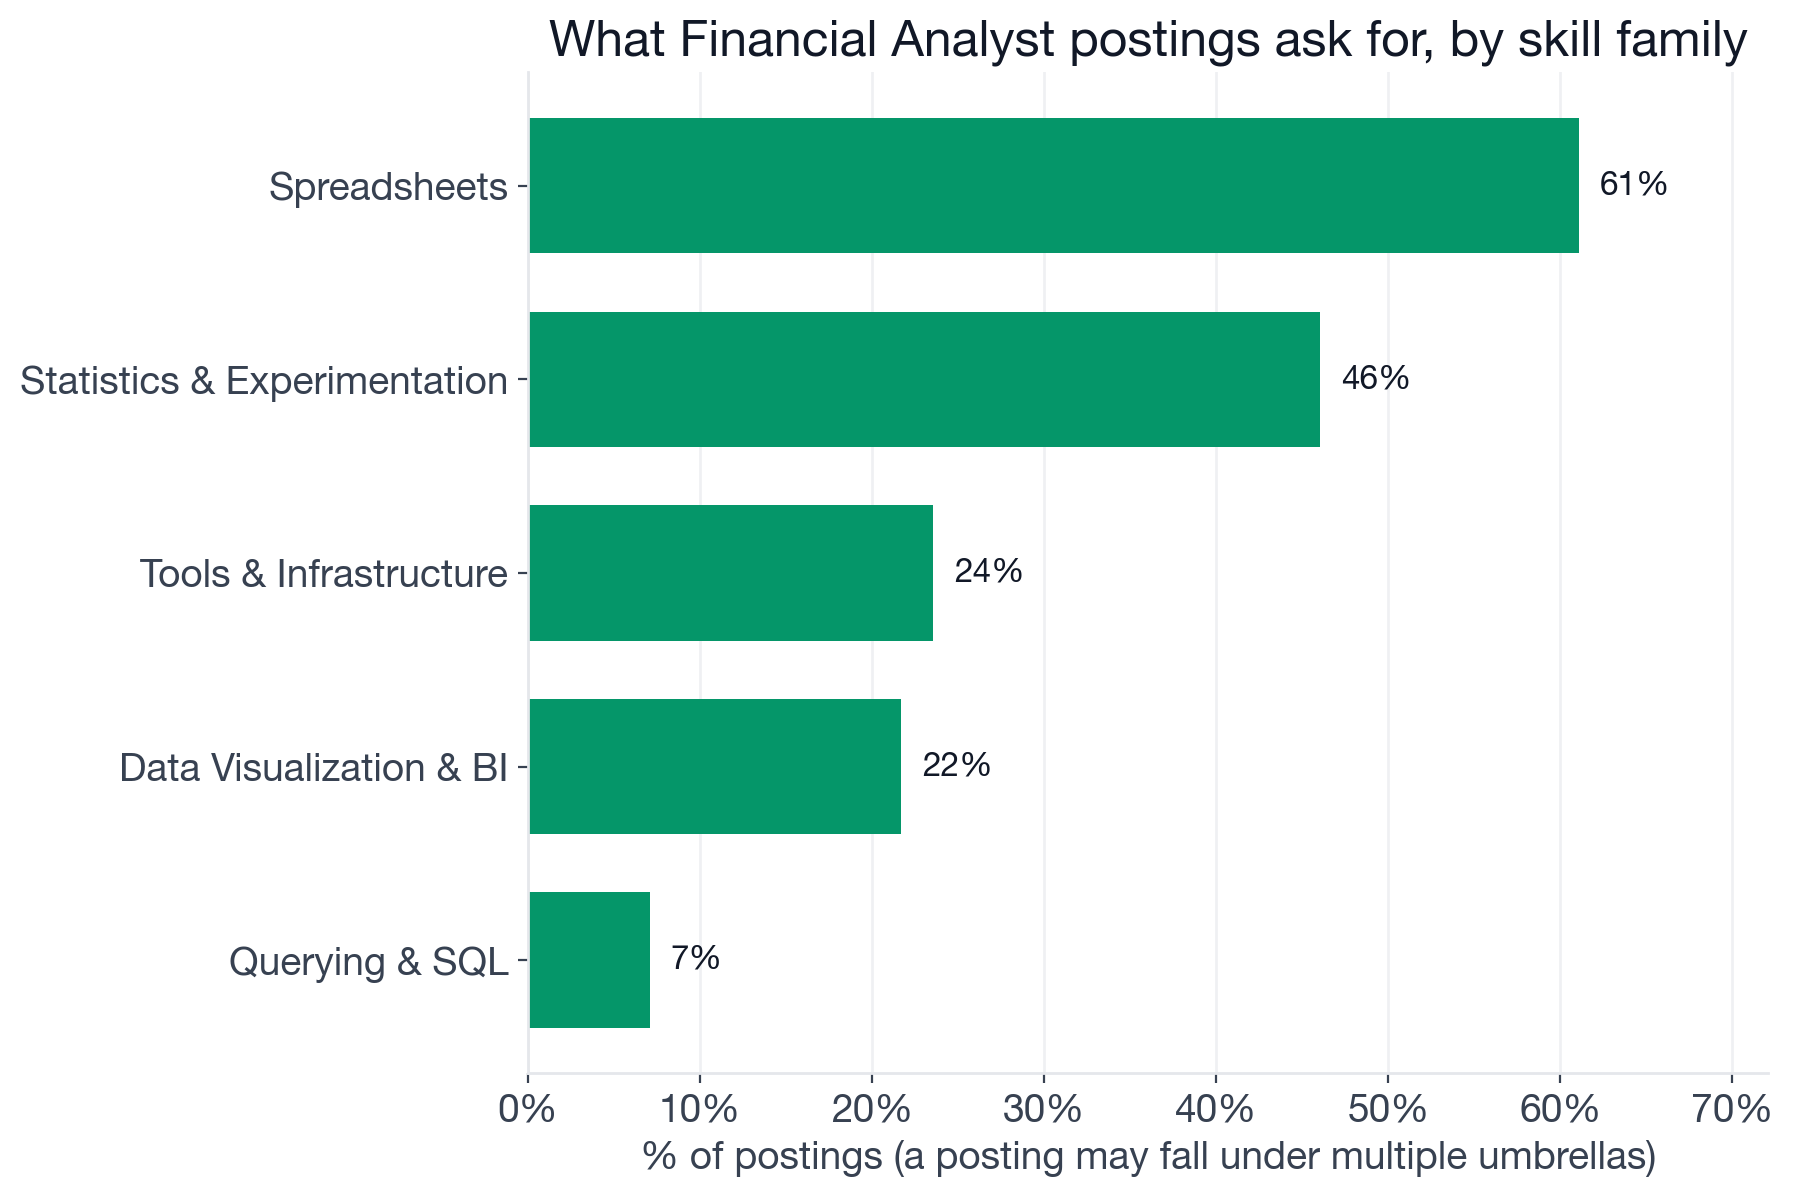
Share of Financial Analyst postings that ask for at least one skill in each family. A posting that mentions both Power BI and Tableau counts once under "Data Visualization & BI."
Data note: The skill extraction uses analytics-method and infrastructure keyword packs. Finance-domain vocabulary (financial modeling, budgeting, variance analysis, SAP, Oracle Financials, GAAP/IFRS, DCF) is outside these packs and is likely underrepresented in the figures above. The families shown reflect what is measurable with the current extraction framework, not the complete skill landscape for the role.
The families that define the role:
- Spreadsheets: 61.1% (overwhelmingly Excel, with Google Sheets at a distant 2.9%)
- Statistics & Experimentation: 46.0% (driven almost entirely by Forecasting at 43.1%)
- Tools & Infrastructure: 23.5% (Automation at 13.5% signals workflow and reporting efficiency; Monitoring at 11.6% is a broad job-posting term covering budget variance tracking, KPI monitoring, and operational performance reporting)
- Data Visualization & BI: 21.7% (Power BI, Tableau, and generic data visualization skills)
- Other: 21.0% (Netsuite, Salesforce, and CRM systems signal sector-specific requirements)
- Querying & SQL: 7.1% (present but clearly a differentiator, not a default)
- Coding Languages: 3.4% (Python shows up in fewer than 1 in 40 postings)
The contrast with data-adjacent roles is sharp. Machine Learning & AI sits at just 1.8% and Cloud Platforms at 0.6%. This is not a data engineering role or a machine learning role. It is a numbers-and-judgment role, where the core competency is taking historical financial data, modeling what comes next, and communicating that clearly to decision-makers. The tools just happen to be Excel, a BI platform, and increasingly, automation layers built on top of both.
What Are the Three Tiers of Individual Financial Analyst Skills?
Drill into individual skills and three clear bands emerge.
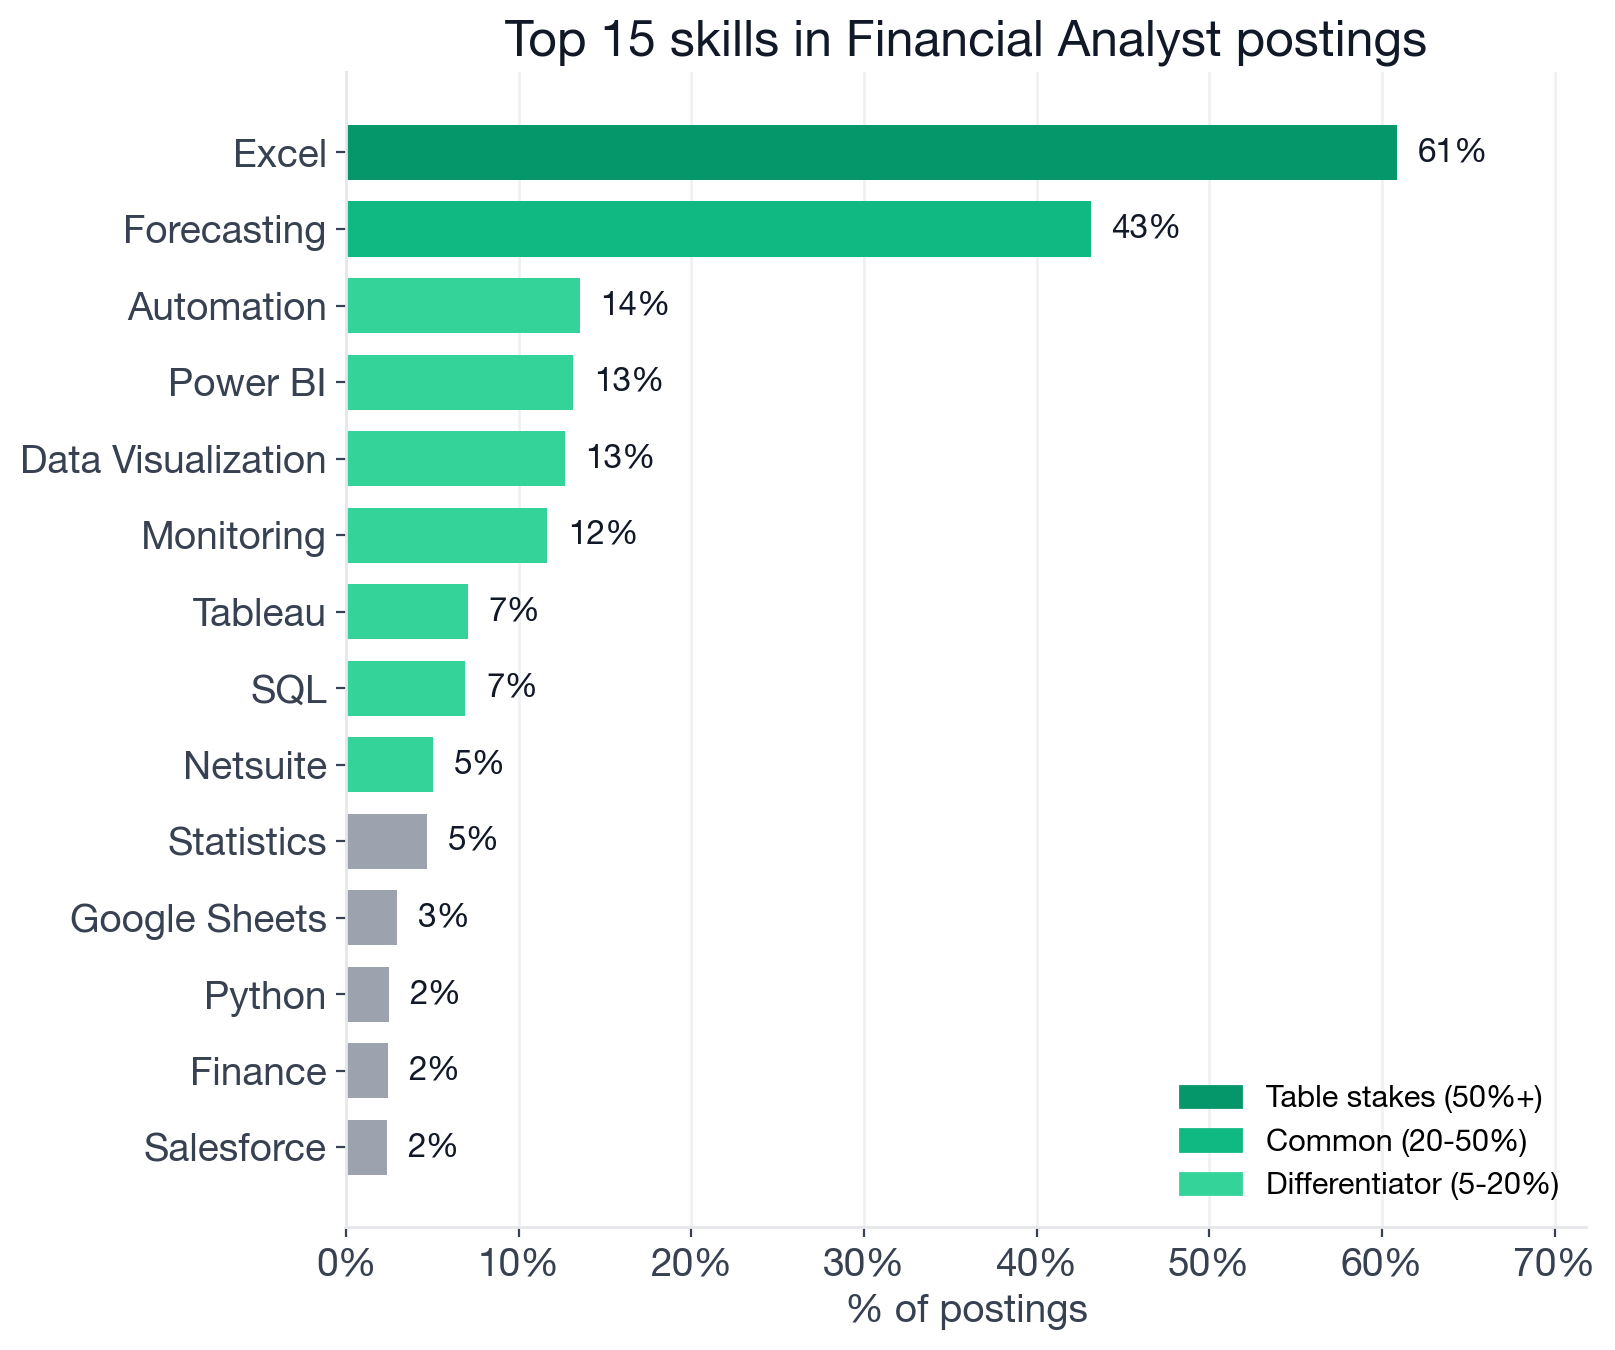
Top individual skills in Financial Analyst postings, by share of listings. Skills above 50% are table stakes; 20-50% are common; 5-20% are differentiators. Generic role keywords and universal soft skills are filtered out before counting.
Table Stakes (50%+ of postings)
Only one skill clears this bar.
- Excel: 60.9% (browse Financial Analyst openings that list Excel)
Financial Analyst is one of the only roles in the tech-adjacent market where a single tool is this dominant. Three in five postings name it explicitly, which understates the actual requirement: postings that don't list Excel still expect it. Treating Excel as optional is not a viable strategy.
Common Expectations (20-50% of postings)
One skill sits in this band.
- Forecasting: 43.1%
Forecasting's presence at 43% is the clearest signal of what Financial Analysts actually do: budget modeling, scenario planning, revenue projections, variance analysis. This is the value-add that separates the FA from an accounts-payable clerk or a bookkeeper. No other skill comes close to this tier. The gap between Forecasting (43%) and the next skill (Automation at 13.5%) is the largest single-band jump in this dataset.
Differentiators (5-20% of postings)
These appear in a minority of postings but reveal the split between generalist FAs and analytics-forward roles.
- Automation: 13.5%
- Power BI: 13.1% (Financial Analyst + Power BI openings)
- Data Visualization: 12.6%
- Monitoring: 11.6% (a broad job-posting term that encompasses budget variance tracking, financial KPI monitoring, and operational performance reporting; not a single coherent tool or methodology)
- Tableau: 7.1% (Financial Analyst + Tableau openings)
- SQL: 6.9%
- Netsuite: 5.0% (an ERP platform widely used in finance operations and accounting workflows)
The BI tools cluster is telling. Power BI leads Tableau nearly 2:1 (13.1% vs 7.1%), which aligns with its broader enterprise footprint in corporate finance and healthcare. Neither is table stakes, though. The Financial Analyst who adds a BI skill is stepping from generalist to analytics-forward, a distinction the salary data will confirm.
One outlier worth noting: SQL at just 6.9% is a full order of magnitude below where it sits for Data Analyst or Data Engineer postings (roughly 70-71%). Financial Analysts are generally not expected to query databases directly. When SQL appears, it signals a hybrid role closer to a BI Analyst or FP&A Analyst profile.
A note on AI skills: The Machine Learning & AI umbrella is 1.8% of postings. That number measures roles explicitly hiring analysts to build or architect AI systems, not roles that expect analysts to use AI tools day-to-day. Those are very different things. Gartner surveyed 183 senior finance leaders in 2025 and found 59% of finance functions already using AI tools, up from 37% in 2023. Gartner also projects that 90% of finance functions will deploy at least one AI-enabled solution by end-2026. Microsoft Copilot in Excel, ChatGPT for variance narratives, and AI-assisted forecasting platforms are already in daily use at many employers. Job postings don't list "uses ChatGPT" as a requirement any more than 2005 postings said "uses the internet." If you are entering finance in 2026, AI fluency is a baseline expectation, not a specialty. The 1.8% tells you how many employers are hiring analysts to build AI systems; it says nothing about how many expect you to use them.
Which Financial Analyst Skills Pay More Than the Baseline?
Salary numbers below are restricted to US postings only (where wage-transparency laws produce consistent disclosure) and reflect base salary only. Equity, bonuses, and sign-on are not captured in posting data, so total compensation at top employers runs meaningfully higher, particularly in financial services and tech.
The overall median US base salary for Financial Analyst postings is $82,000 (n=1,041 postings with disclosed US salary data).
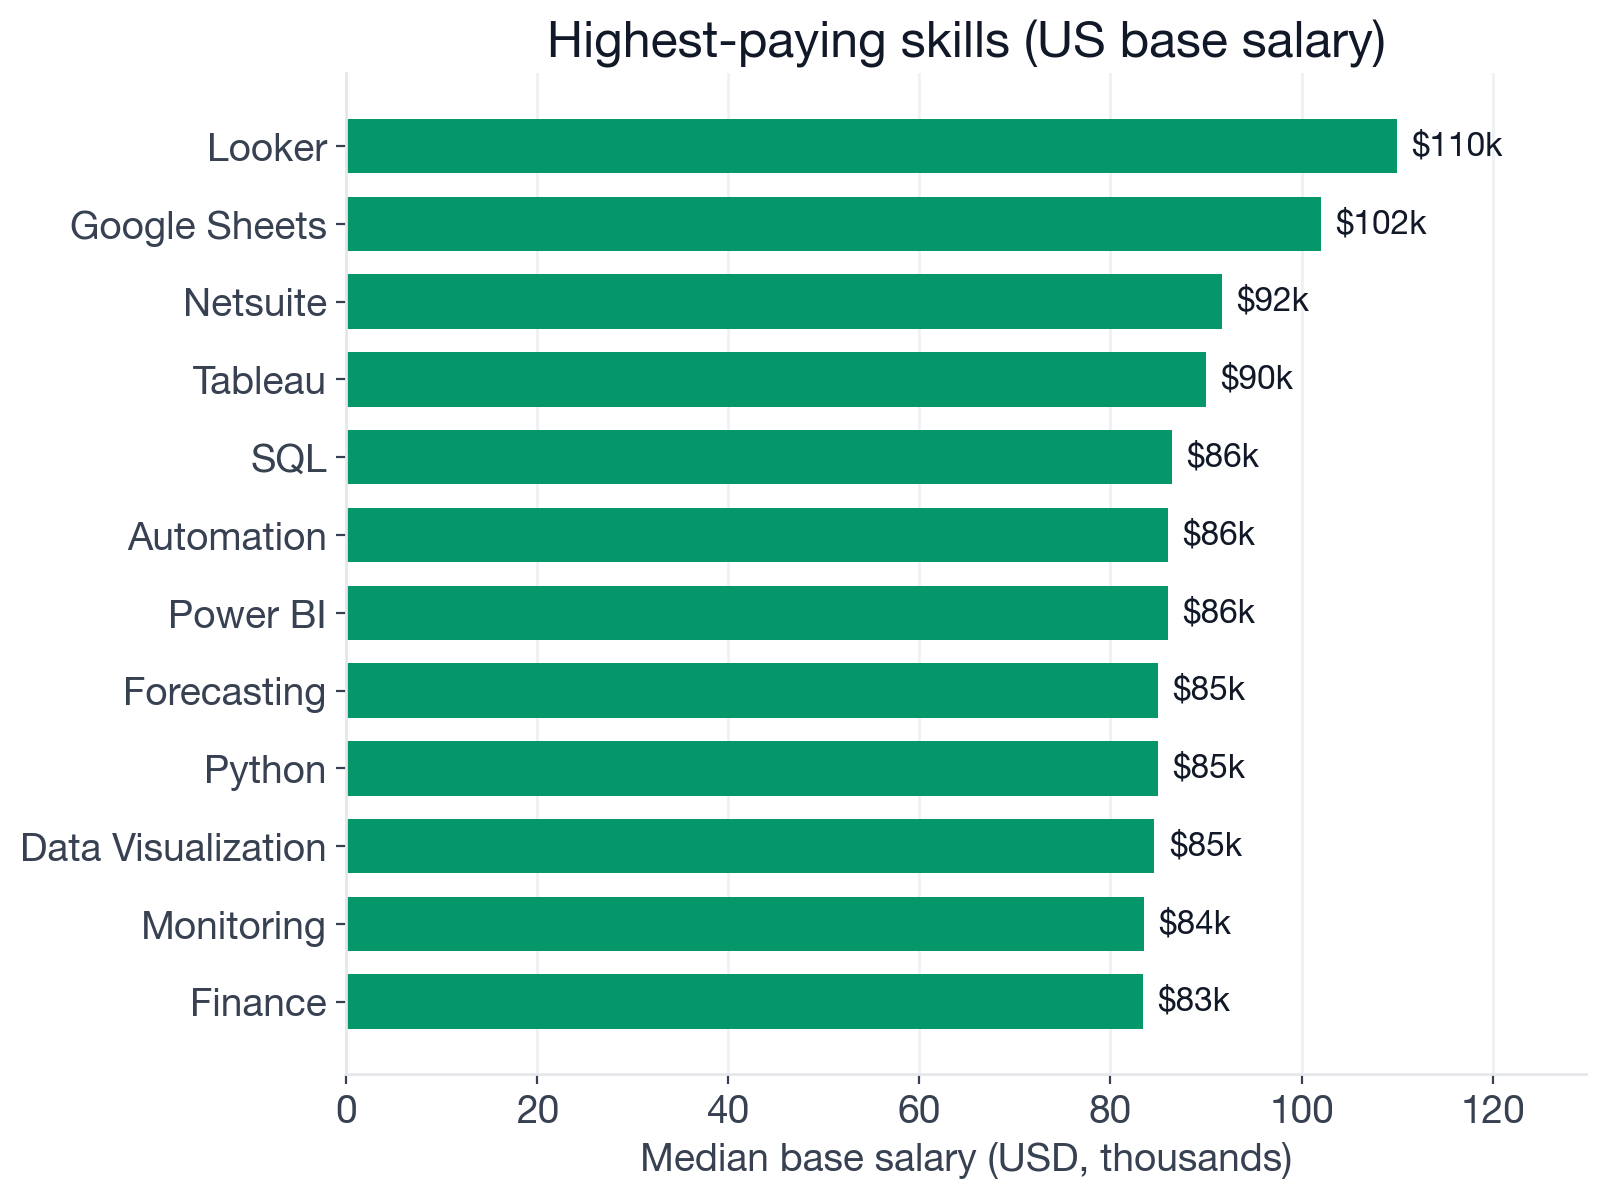
Median US base salary in USD for postings that mention each skill, among US Financial Analyst postings with structured salary data. Looker and Google Sheets have smaller samples (n=27 each) and should be treated as directional.
The salary premiums for this role are more compressed than in engineering, but meaningful:
Top premiums ($8K-$10K above the $82,000 baseline):
- Netsuite: $91,700 median (n=78), about $9,700 above baseline
- Tableau: $90,000 median (n=135), about $8,000 above baseline
Mid-range premiums ($4K-$5K):
- SQL: $86,400 (n=110), about $4,400 above baseline
- Automation: $86,000 (n=179), about $4,000 above baseline
- Power BI: $86,000 (n=178), about $4,000 above baseline
Smaller premiums (up to $3K):
- Forecasting: $85,000 (n=597), about $3,000 above baseline
- Data Visualization: $84,600 (n=194), about $2,600 above baseline
- Monitoring: $83,500 (n=99), about $1,500 above baseline
- Excel: $82,800 (n=728), about $800 above baseline (essentially at floor)
Two entries sit well above the pack: Looker (a BI tool in Google Cloud's analytics suite) at $110,000 (n=27) and Google Sheets at $102,000 (n=27). Both have smaller samples and the elevated medians likely reflect that companies using these tools tend to be data-forward, tech-sector employers who pay more broadly, not Looker- or Sheets-specific premiums. Treat them as directional.
The pattern is useful: the skills that show up in nearly every posting (Excel, Forecasting) have flat salary distributions because they're expected of everyone. The skills present in the minority (Netsuite, Tableau, SQL) pay more because they narrow the candidate pool. Adding Netsuite or Tableau fluency earns a real $8-10K lift. SQL earns about $4.4K. These are meaningful gains on an $82,000 baseline.
What Is the Dominant Financial Analyst Skill Stack?
We computed every two-skill co-occurrence among the top skills to find which combinations appear together more often than chance. Lift greater than 1.0 means the pair appears together more often than their individual frequencies would predict.
| Skill pair | Postings | % of market | Lift |
|---|---|---|---|
| Power BI + Tableau | 200 | 4.3% | 4.61 |
| SQL + Tableau | 100 | 2.1% | 4.39 |
| Data Visualization + Power BI | 291 | 6.2% | 3.74 |
| Data Visualization + Tableau | 143 | 3.1% | 3.43 |
| Power BI + SQL | 131 | 2.8% | 3.09 |
| Automation + Data Visualization | 187 | 4.0% | 2.34 |
| Automation + SQL | 102 | 2.2% | 2.33 |
| Automation + Power BI | 179 | 3.8% | 2.15 |
| Data Visualization + Forecasting | 478 | 10.2% | 1.87 |
| Forecasting + Power BI | 480 | 10.3% | 1.81 |
| Forecasting + SQL | 221 | 4.7% | 1.59 |
| Excel + Forecasting | 1,478 | 31.6% | 1.20 |
The pairs tell a clearer story than individual frequencies.
- Power BI + Tableau (lift 4.61) is the strongest signal in the dataset. When both BI tools appear in the same posting, the company is building standardized reporting infrastructure and wants someone who can operate across both ecosystems. These are the analytics-forward FA roles with the highest salary potential.
- Data Visualization + Forecasting (lift 1.87) and Forecasting + Power BI (lift 1.81) together define the modern FP&A analyst: build the model, then surface the outputs in a BI tool. These two pairs cover 10% of the market each.
- Automation + [any visualization tool] (lift 2.15-2.34) signals a role where the analyst is scripting the data pull, not just presenting the result. These roles tend to carry higher pay because they reduce the dependency on a separate data team.
- Excel + Forecasting (lift 1.20, 1,478 postings) is the broadest foundational pair. Nearly 32% of all postings want both. It is the baseline expectation: model in Excel, project the numbers. Everything above it is how companies distinguish the generalist FA from the analytics-forward one.
The market has two profiles. The generalist FA (Excel plus Forecasting, 31.6% of postings) and the analytics-forward FA (Power BI or Tableau paired with SQL or Automation, smaller volumes but the highest-lift pairs and highest median salaries). Knowing which profile you are targeting shapes which differentiator to build first.
Who's Hiring at Which Seniority Level?
Seniority is tagged based on title keywords. Postings with no explicit signal default to mid-level.
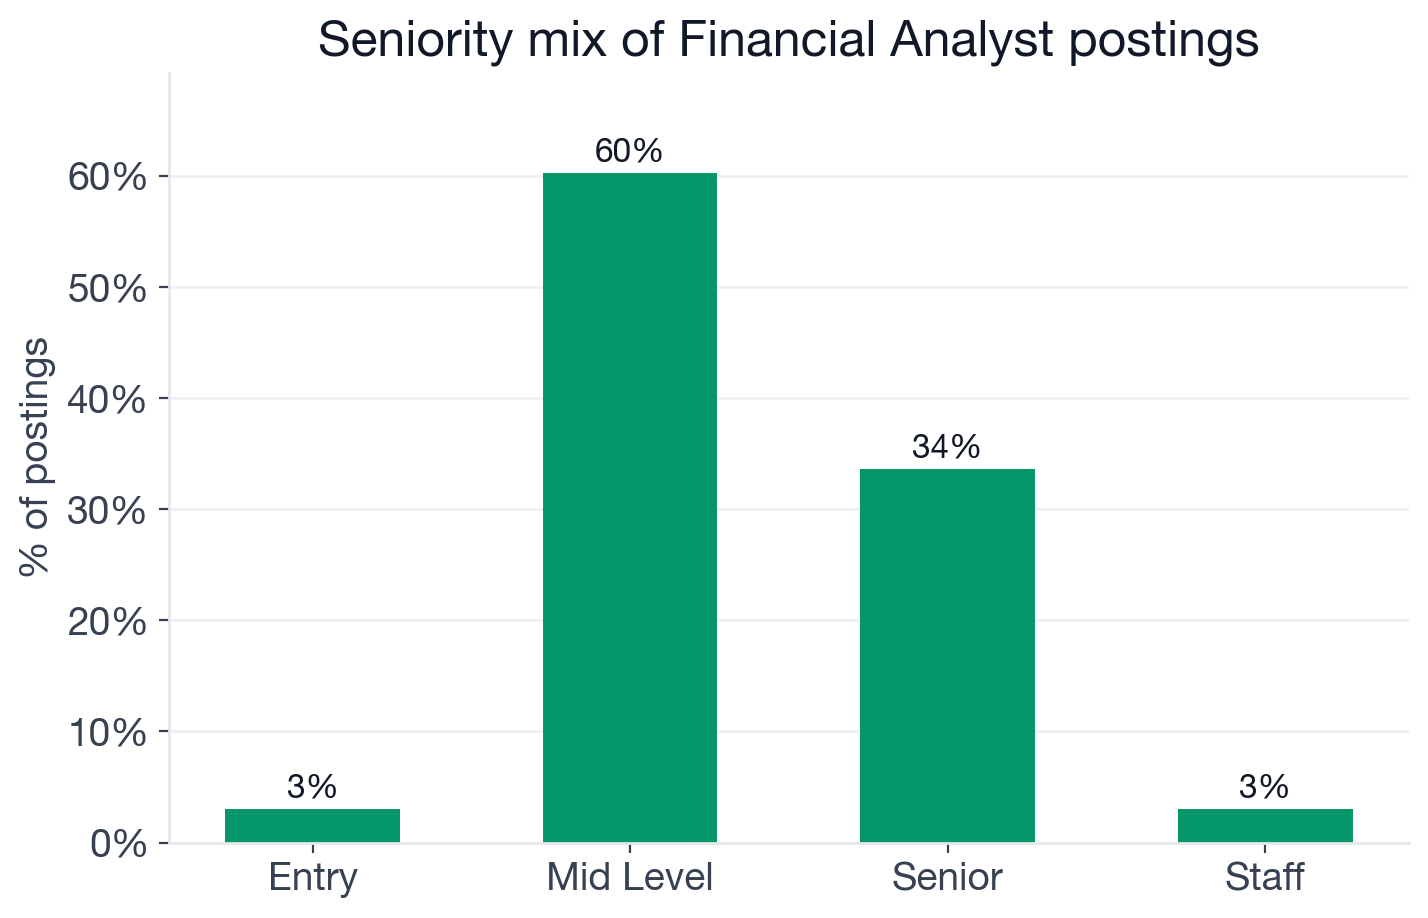
Seniority distribution of Financial Analyst postings, May 2026.
- Mid-level: 60.3% (2,820 postings)
- Senior: 33.7% (1,575 postings) (senior Financial Analyst openings)
- Entry: 3.1% (143 postings)
- Staff / Lead: 3.0% (142 postings)
The entry-level door is nearly closed: only 3.1% of postings are explicitly entry-level, roughly 1 in 32 openings. For reference, Data Analyst roles run closer to 7.7% entry-level (per our Data Analyst analysis). Financial Analyst hiring assumes you have already done the work somewhere. Companies expect candidates who can deliver a budget variance analysis or a rolling forecast independently in their first 30 days.
The senior tier is equally notable. At 33.7%, senior-level roles make up a third of the entire market. Combined with staff/lead (3%), roughly 37% of postings are senior-and-above. For someone with 4-6 years of experience, the market is genuinely broad. The differentiator skills (Tableau, Netsuite, SQL) appear more often in senior postings, which helps explain their salary premiums: companies pay for the experience to use those tools well.
Where Are Financial Analyst Jobs Located, and How Remote-Friendly Are They?
The United States dominates Financial Analyst hiring in a way it doesn't for most tech-adjacent roles.
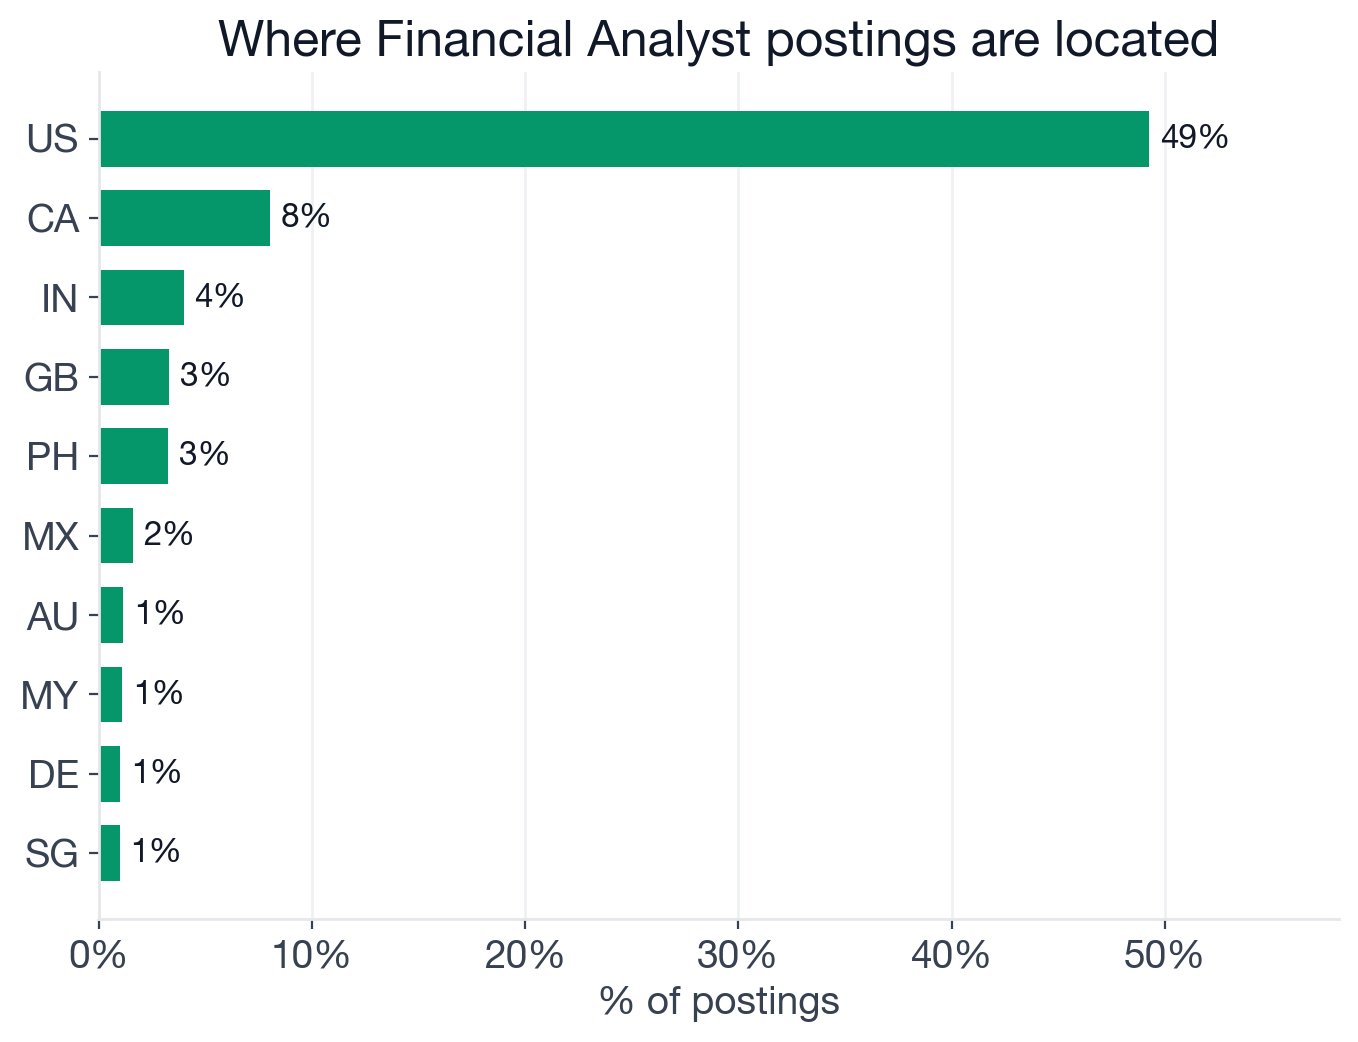
Top countries by share of Financial Analyst postings, May 2026.
- United States: 49.3% (2,306 postings) (US Financial Analyst openings)
- Canada: 8.1% (377)
- India: 4.0% (187)
- United Kingdom: 3.3% (155)
- Philippines: 3.3% (153)
- Mexico: 1.6% (75)
- Australia: 1.2% (54)
- Malaysia: 1.1% (52)
- Germany: 1.0% (48)
North America accounts for 57% of the global market combined. For comparison, Data Engineer postings split roughly 29% US and 23% India. Financial Analyst skews heavily toward American companies, which tracks: much of the demand comes from corporate FP&A, real estate, healthcare finance, and manufacturing, industries with large North American footprints. The US salary numbers cited in this post apply well to the majority of open roles.
The remote picture is below average for an analytical role.
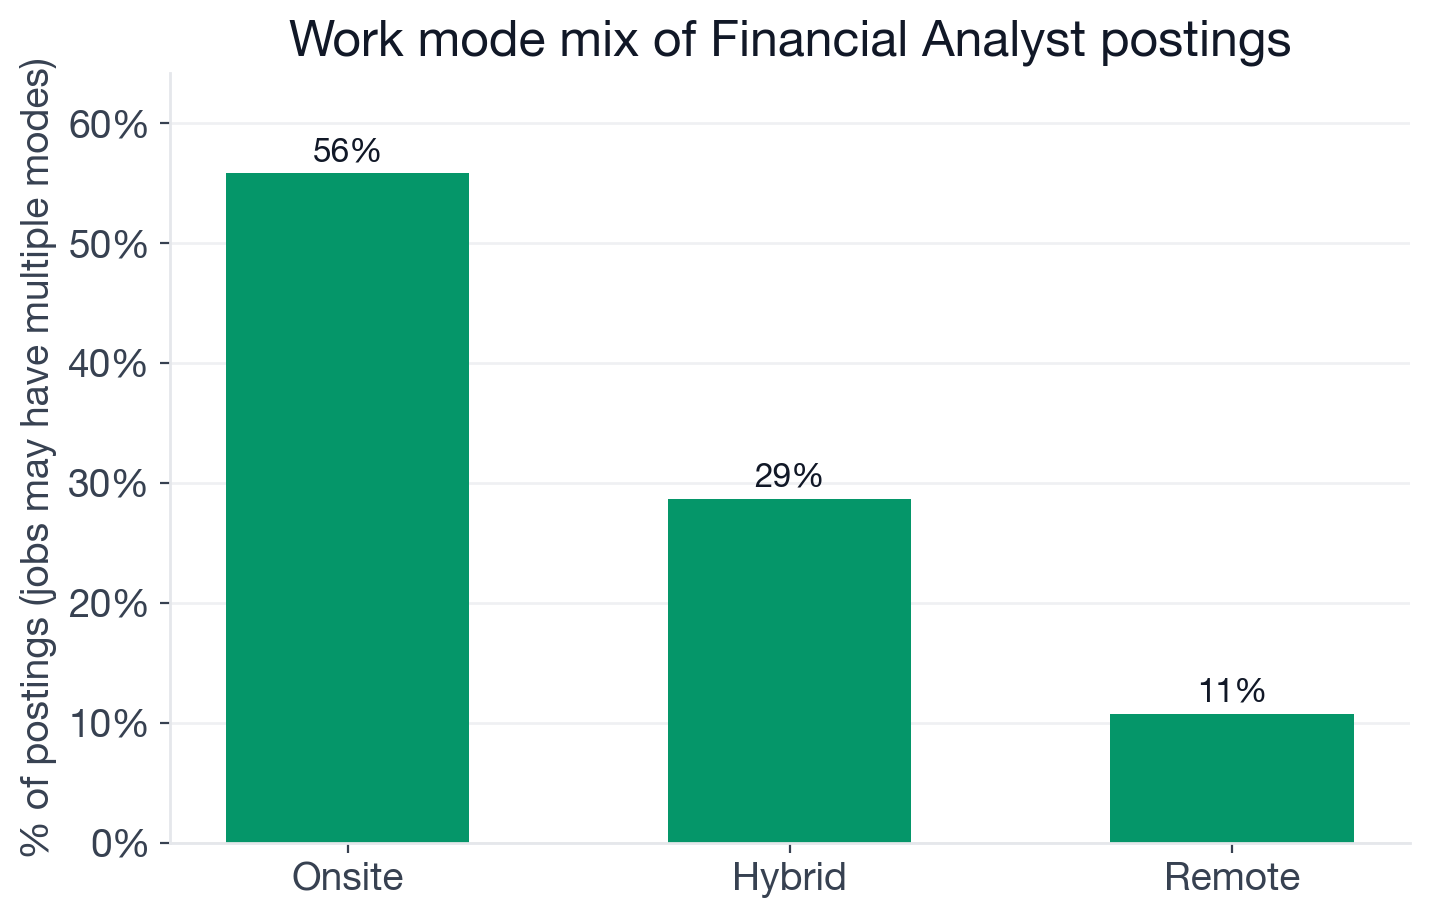
Share of Financial Analyst postings by work mode. Postings without a disclosed mode (11.8%) are excluded.
- Onsite: 55.8% (2,613 postings)
- Hybrid: 28.7% (1,342)
- Remote: 10.7% (503) (remote Financial Analyst openings)
More than half of all postings require in-person presence. Financial Analyst roles typically sit inside finance, accounting, or FP&A teams that operate on face-time norms, close to the business stakeholders and budget owners they support. Remote financial analyst roles do exist and concentrate in software companies and fintech, but they represent only 1 in 10 postings. If remote flexibility is a priority, this role requires deliberate filtering.
Who's Hiring Financial Analysts in 2026?
The top hiring companies span a wider industry range than almost any other role we have analyzed, which reflects the Financial Analyst title's presence across nearly every sector.
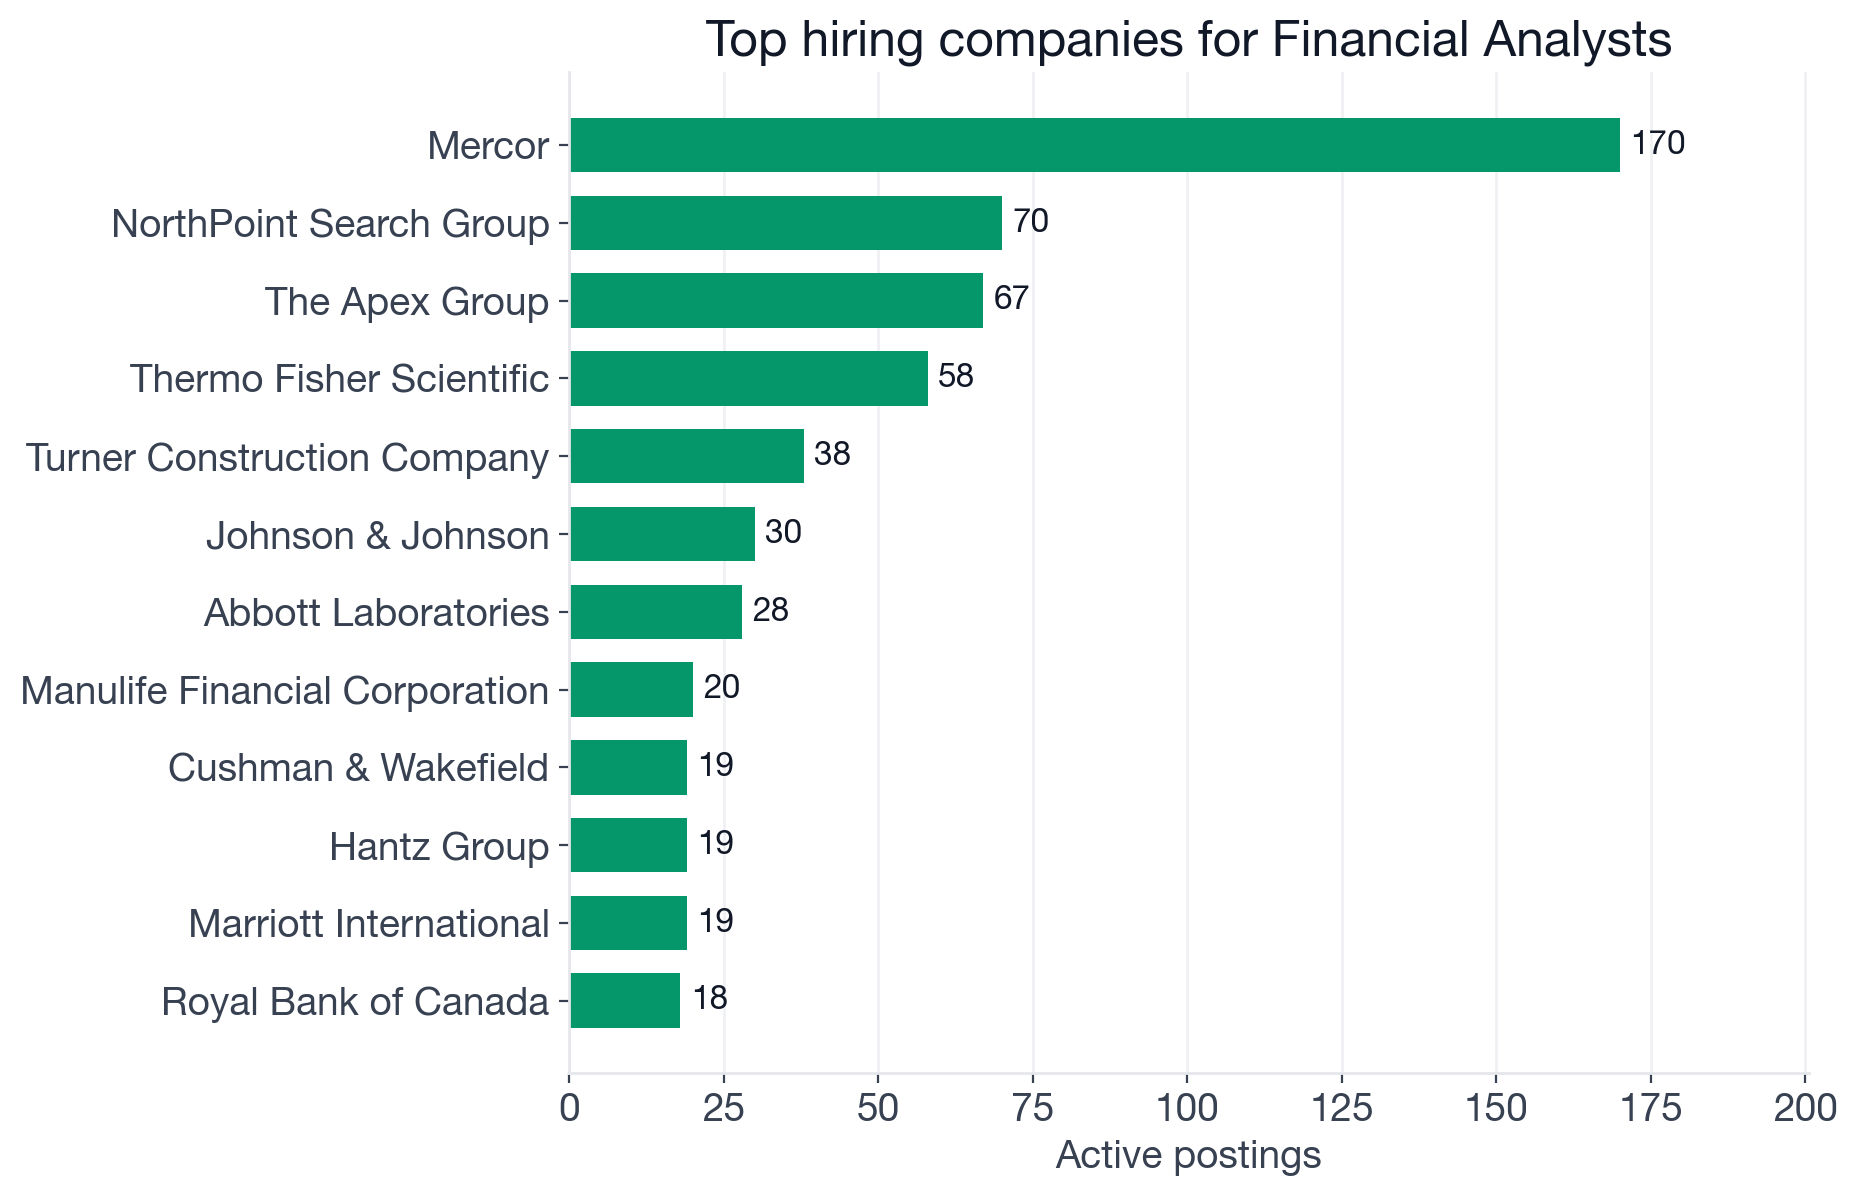
Top companies by active Financial Analyst postings, May 2026.
- Mercor: 170 postings (AI-powered talent marketplace)
- NorthPoint Search Group: 70 (staffing and recruitment)
- The Apex Group: 67 (financial services and fund administration)
- Thermo Fisher Scientific: 58 (life sciences and diagnostics)
- Turner Construction Company: 38 (construction)
- Johnson & Johnson: 30 (healthcare)
- Abbott Laboratories: 28 (healthcare)
- Manulife Financial Corporation: 20 (insurance and asset management)
- Cushman & Wakefield: 19 (commercial real estate)
- Hantz Group: 19 (financial advisory)
- Marriott International: 19 (hospitality)
- Royal Bank of Canada: 18 (banking)
Healthcare, construction, real estate, hospitality, banking, insurance: Financial Analysts serve the finance function across every sector. That breadth is a genuine career advantage. Skills built at a healthcare company translate directly to a real estate firm or a bank because the FP&A craft is fundamentally the same regardless of industry. Budget variance is budget variance. The job search can be sector-agnostic, which opens more options than roles tied to a specific tech stack.
How to Use This in Your Financial Analyst Job Search
The data points to a clear sequence.
Build Excel and forecasting as foundations, not afterthoughts. Sixty percent of postings require Excel and 43% require forecasting as explicit skills. Financial Analyst interviews typically involve a case: you're handed a dataset and asked to model a scenario, build a budget variance analysis, or forecast a revenue line. Practice with AI mock interviews to run those scenarios under realistic conditions and get feedback on your modeling approach, communication, and judgment calls before you're in front of a hiring panel.
Pick one BI tool and go deep. Power BI leads at 13.1% with a broader enterprise footprint, making it the safer default for corporate finance roles. Tableau earns a slightly higher salary median and appears more often at analytics-forward tech and data companies. Pick based on the companies you want to target, not on abstract popularity rankings. The question bank covers data analysis and financial modeling topics that come up in FA interviews, including visualization and forecasting concepts worth drilling before onsite rounds.
Add Netsuite or Tableau for the highest salary return. The two differentiators with the strongest premiums are Netsuite ($9,700 above baseline) and Tableau ($8,000). SQL also earns a real premium at about $4,400 above baseline for analysts who add querying capability. None are common across the market, which is precisely why they pay more: the analyst who knows an ERP system, can build a Tableau dashboard, or can write a SQL query to pull their own data doesn't need a separate team standing between them and the numbers. That independence has real salary value.
Plan for an onsite-first search. Only 10.7% of Financial Analyst postings offer full remote. If remote flexibility is a priority, focus your search on tech and software companies and filter for remote Financial Analyst openings directly on the job board. The sector matters as much as the role here.
Before applying to specific companies, interview preparation guides break down how finance rounds are structured at different employers, including the case studies and modeling exercises that appear in senior FA hiring.
FAQ
Q. What skills do companies want for Financial Analyst roles in 2026?
Excel is the single table-stakes skill, appearing in 60.9% of postings (2,849 of 4,680 analyzed). Forecasting is the one common skill at 43.1%. The differentiator tier includes Automation (13.5%), Power BI (13.1%), Data Visualization (12.6%), Monitoring (11.6%), Tableau (7.1%), SQL (6.9%), and Netsuite (5.0%). Explicit AI/ML requirements show up in only 1.8% of postings, but that measures roles built around AI; ambient AI tool use across finance is far higher, with 59% of finance functions actively using AI as of 2025 (Gartner).
Q. What is the median salary for a Financial Analyst in 2026?
The median US base salary is $82,000, based on 1,041 postings with disclosed US salary data. Equity, bonuses, and sign-on are not captured in posting data, so total compensation at top employers is higher. Among differentiator skills, Netsuite postings pay a median of $91,700 (n=78) and Tableau postings $90,000 (n=135).
Q. Which Financial Analyst skills pay the most above the baseline?
Among US postings with sufficient salary data, Netsuite earns the largest confirmed premium at $91,700 median (n=78, about $9,700 above the $82,000 baseline), followed by Tableau at $90,000 (n=135, +$8,000), SQL at $86,400 (n=110, +$4,400), Automation at $86,000 (n=179, +$4,000), and Power BI at $86,000 (n=178, +$4,000). Looker shows $110,000 (n=27) but the smaller sample warrants caution.
Q. How hard is it to break into Financial Analyst roles as an entry-level candidate?
Quite difficult. Only 3.1% of Financial Analyst postings are explicitly entry-level (143 of 4,680), while 60.3% are mid-level. Companies typically expect candidates who can model, forecast, and produce deliverables independently. Finance degree programs, internships, and accounting or FP&A certification paths are the most common entry routes.
Q. Where are most Financial Analyst jobs located, and how remote-friendly are they?
The United States accounts for 49.3% of all postings (2,306 of 4,680), making this one of the most US-concentrated roles analyzed. Canada adds another 8.1%. The role skews heavily onsite: 55.8% of postings require in-office presence, 28.7% are hybrid, and just 10.7% are fully remote.
Q. Which companies hire the most Financial Analysts in 2026?
Mercor leads with 170 active postings, followed by NorthPoint Search Group (70), The Apex Group (67), Thermo Fisher Scientific (58), Turner Construction Company (38), Johnson & Johnson (30), Abbott Laboratories (28), Manulife Financial Corporation (20), Cushman & Wakefield (19), Hantz Group (19), and Marriott International (19). The mix spans staffing firms, healthcare, construction, and financial services, reflecting the role's reach across industries.
Final Thoughts
Financial Analyst remains one of the most industry-agnostic roles in the professional world: the same core craft (model, forecast, communicate) shows up in healthcare, construction, banking, and hospitality. That breadth is a career advantage, but it also explains why the skill profile is narrow at the top (Excel, Forecasting) and selective at the differentiator level. The analysts who separate themselves add a BI tool, sharpen their ERP fluency, or pick up SQL, and the salary data rewards all three. In 2026, the fastest-growing layer of the role isn't on most job postings at all: it's the AI tool fluency that finance teams are embedding into their workflows whether the job description mentions it or not.
Topics
Ready to practice?
Put what you've learned into practice with AI mock interviews and structured preparation guides.