
The Research Scientist Experimental Evaluation and Success Metrics Interview Starts With a Metric You Can't Directly Measure
Picture a mid-level Research Scientist interview at a large consumer tech company. A team has built a new ranking method for short-form educational videos in the app's learning feed, and the stated goal is to "help users learn more effectively without hurting engagement." There is no field in any database called "learning." The candidate has to define what success even means before they can measure it, and the interviewer's own first follow-up baits the easiest wrong answer: defaulting to watch time.
This walkthrough is built on one real InterviewStack.io AI-interview blueprint (the same interview_package structure that scores a live mock interview), scored across a 100-point rubric in four dimensions. It follows a candidate, Owen, through the mistakes a prepared but unpracticed candidate actually makes, and what the stronger version of each answer looks like.
Key Findings
- The rubric totals 100 points: 30 for Interviewer Objectives Alignment, 30 for Level-Specific Expectations, 20 for Technical Proficiency, and 20 for Communication and Problem Solving.
- The interview runs 30 minutes across 3 phases: 0-10 minutes on problem framing and metric definition, 10-22 minutes on evaluation design and baselines, and 22-30 minutes on decision criteria and risk.
- Evaluation design and baselines is the longest single phase at 12 of 30 minutes, roughly 40% of the interview.
- The blueprint expects at least 2 named baselines: the current production ranking model and a simpler heuristic alternative.
- Phase 3 requires naming at least 2 realistic risks, such as proxy mismatch, short-term versus long-term effects, creator unfairness, or metric gaming.
- This walkthrough dramatizes 4 of the blueprint's 6 interviewer follow-up prompts.
- 4 topics are explicitly off-limits for this level, including low-level model architecture design and deep mathematical derivations of ranking algorithms, keeping the interview focused on evaluation judgment, not math.
The interview question
You are joining a research review for a large consumer technology company. A team has developed a new ranking method for short-form educational videos shown in the app's learning feed. The stated goal is to help users learn more effectively without hurting engagement.
The team has historical interaction logs, lightweight user feedback signals, creator metadata, and the ability to run a limited A/B test on a small percentage of traffic.
How would you design the evaluation and success criteria for this new ranking method before the team decides whether to launch it?
What Does the Interviewer Actually Want to See in This Ranking Review?
The interviewer is not looking for a specific metric name. They are testing whether a mid-level Research Scientist can translate a vague, feel-good objective into primary, secondary, and guardrail metrics, choose baselines that make the comparison meaningful, distinguish what offline data can prove from what only a randomized test can, and land on an explicit launch recommendation instead of an open-ended discussion. At this level, that structure is expected to come from the candidate with little prompting; the interviewer is not going to hand it to them.
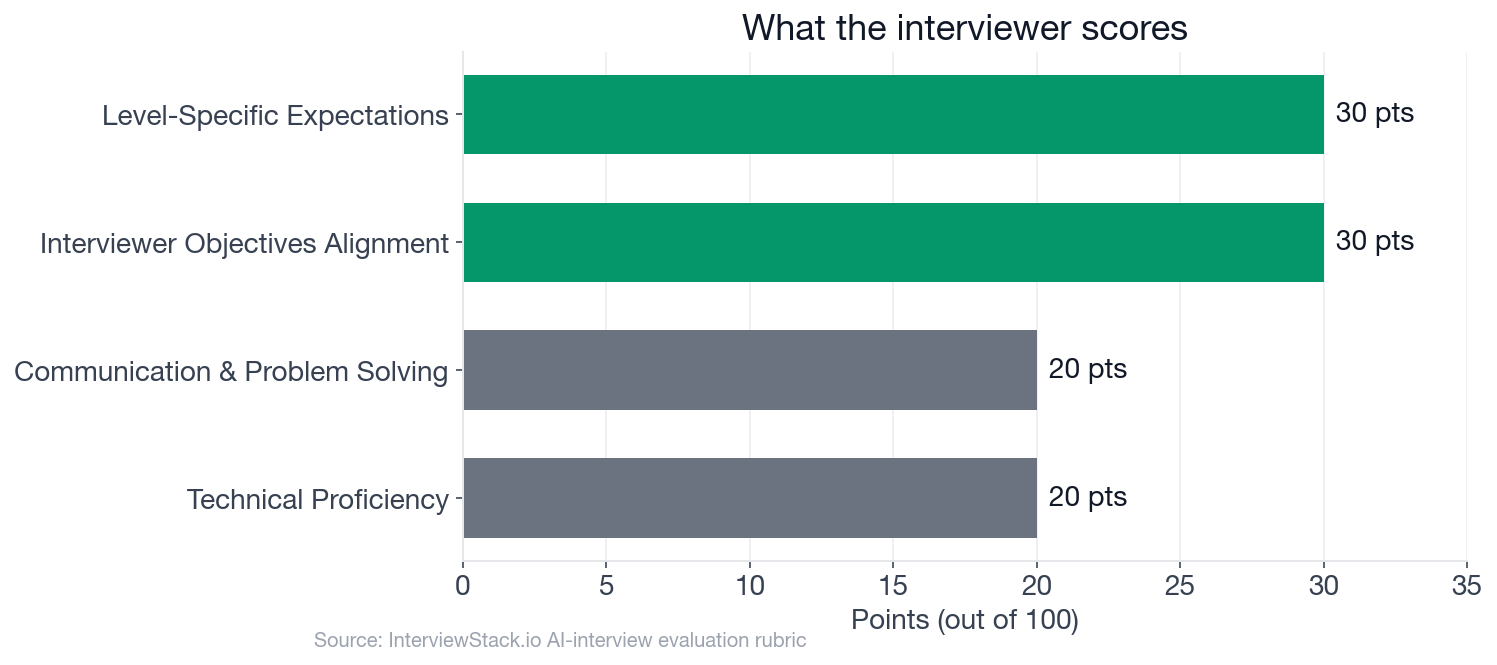
Notice how the rubric is weighted: 60 of the 100 points sit in Interviewer Objectives Alignment and Level-Specific Expectations combined, the two dimensions most sensitive to what metric a candidate picks and how independently they structure the plan. Technical correctness matters, but it is not where this interview is decided.
The Walkthrough
Turn 1: Naming the Primary Metric
Interviewer: "What would you choose as your primary success metric, and why is it a better fit than a pure engagement metric like watch time?"
Turn 2: Handling No Ground Truth
Interviewer: "Suppose there is no direct ground-truth label for whether a user actually learned something from a video. How would you handle that in your evaluation plan?"
Turn 3: The Segment That Got Left Behind
Interviewer: "If the new method improves your learning metric overall but hurts a segment such as new users or smaller creators, how would that affect your launch recommendation?"
Turn 4: Naming the Way It Gets Gamed
Interviewer: "What failure modes or ways of gaming the metrics would you worry about, and how would you guard against them?"
Why Doesn't Catching These Mistakes on the Page Make Them Easy to Avoid Live?
Reading Owen's mistakes above probably felt obvious. That is the trap. On the page, you have unlimited time, no interviewer waiting for an answer, and the mistake already labeled in red. Live, you have 30 minutes, a follow-up question you did not expect, and a proxy metric a hiring manager will ask you to defend on the spot. The gap between spotting a mistake on the page and not making it live only closes with reps, ideally against a system that scores you the way this rubric actually scores.
What Separates a Passing Answer From a Strong One Here?
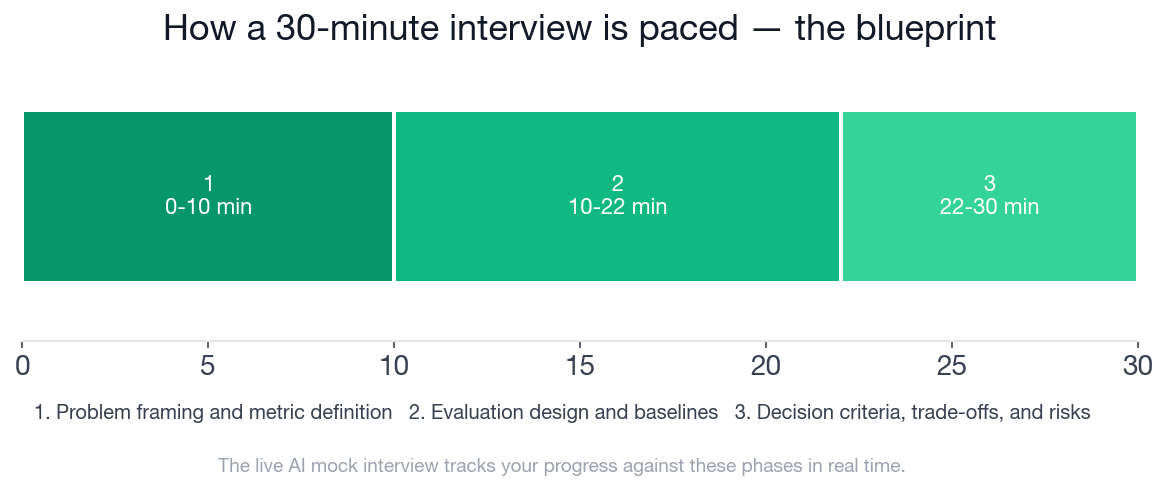
The chart above is the pacing a strong candidate actually hits: metric definition wrapped by minute 10, baselines and offline-to-online criteria built out through minute 22, and the last 8 minutes spent on a concrete decision rule and named risks, not more metric brainstorming. The card below is the same blueprint the AI mock interview tracks you against in real time, phase by phase, checklist item by checklist item.
- ✓Restates the goal in measurable terms, separating learning effectiveness from engagement preservation
- ✓Proposes at least one plausible primary metric tied to learning, even if proxy-based
- ✓Introduces supporting metrics and guardrails rather than relying on a single number
- ✓Explains why chosen metrics align with the real-world objective and potential launch stakes
- ✓Separates what can be learned from historical logs versus randomized online tests
- ✓Names concrete baselines such as current production model and a simpler ranking heuristic
- ✓Discusses how to evaluate proxy-label quality or missing ground truth
- ✓Includes segmentation or slice analysis for users, content, or creators
- ✓Mentions criteria for progressing from offline evaluation to online experimentation
- ✓States explicit success thresholds or a launch decision framework
- ✓Reasons about trade-offs when metrics move in opposite directions
- ✓Identifies at least two realistic risks such as proxy mismatch, short-term versus long-term effects, creator unfairness, or gaming
- ✓Explains what additional evidence would change their recommendation if results are mixed
Close the Gap With a Live Rep
Everything above is illustrative coaching built from a real interview blueprint, not a transcript to memorize. The scenario, the exact follow-ups, and the phase timing will differ in a live session, which is the point: you need to practice building this structure on the fly, not recalling Owen's answers.
Start the AI mock interview on Experimental Evaluation and Success Metrics to run this exact blueprint live, with scored feedback on every phase. If you want to drill the underlying concepts first, such as proxy metrics, baseline selection, or offline-to-online decision criteria, work through the Research Scientist question bank on this topic or build foundational fluency in experimental design through interactive courses. For company-specific process notes, browse InterviewStack.io's preparation guides.
FAQ
Q. What does the Research Scientist Experimental Evaluation and Metrics interview actually ask?
The blueprint used in this walkthrough puts a mid-level Research Scientist in front of a ranking method for short-form educational videos and asks them to design the evaluation plan and success criteria before the team decides whether to launch it. Over 30 minutes, the interviewer probes metric definition, evaluation design and baselines, and launch decision-making under imperfect measurement.
Q. Why is watch time considered a poor primary success metric for this scenario?
Watch time measures engagement, not learning, and the stated goal is to help users learn more effectively without hurting engagement. The interviewer explicitly asks candidates to justify a metric that is a better fit than a pure engagement metric like watch time, so leading with watch time as the primary metric answers the wrong question and costs points under Interviewer Objectives Alignment.
Q. What baselines should a candidate propose before trusting a new ranking method?
A strong answer names at least two comparison points: the current production ranking model, so the team knows whether the new method is actually better than what already ships, and a simpler heuristic alternative, so a complex method has to earn its complexity rather than win by default against nothing.
Q. When is it justified to move from offline evaluation to an online A/B test?
Offline gains need to be large enough, and consistent enough across data slices, to be worth the cost and risk of a live experiment. A candidate should state an explicit threshold or decision rule rather than a vague 'when it looks promising,' since offline proxy metrics can only suggest a result, not prove one causally.
Q. What happens if the new metric improves overall but hurts a specific user segment?
A strong candidate treats a harmed segment, such as new users or smaller creators, as a gating condition rather than a footnote. That means setting an acceptable regression threshold ahead of time and naming a concrete mitigation, such as a slower rollout or a segment-specific adjustment, if the new method crosses it.
Q. How many rubric points does this interview weigh, and how are they split?
The rubric totals 100 points across four dimensions: Interviewer Objectives Alignment (30 points), Level-Specific Expectations (30 points), Technical Proficiency (20 points), and Communication and Problem Solving (20 points).
Q. How should someone prepare for a Research Scientist interview on experimental evaluation and metrics?
Practice defining primary, secondary, and guardrail metrics for a vague product goal out loud, under time pressure, since that structure is what most of the rubric is scoring. An AI mock interview built on this exact blueprint gives live, scored feedback on where the reasoning breaks down; a question bank drill helps sharpen individual answers first.
The Slice You Don't Check Is the One That Breaks
Every mistake in this walkthrough comes from the same root habit: trusting one aggregate number instead of interrogating it. Watch time as a stand-in for learning, an unvalidated proxy treated as ground truth, an average that hides a hurting segment, a metric nobody stress-tested for gaming. A strong Research Scientist doesn't need a fancier metric than everyone else. They need to keep asking what the number is hiding until the interview runs out of time.
Topics
Ready to practice?
Put what you've learned into practice with AI mock interviews and structured preparation guides.