
A Clean Test Run Can Still Hide a Broken Checkout
You are about to start a 30-minute mid-level QA Engineer interview. The scenario: a consumer checkout flow for a large e-commerce product, shipping weekly, with automated API and UI regression coverage already running in CI. Production keeps taking hits from failed payments and order placement bugs, and engineering leadership has one complaint: the current reporting is just pass and fail counts, and it does not tell them whether a build is safe to ship or where quality is quietly getting worse.
This walkthrough is built from one real interview package generated by InterviewStack.io's production AI mock interview prompt for exactly this scenario, mid-level, Quality Metrics and Test Reporting. The instinct most candidates reach for first, report the pass rate, is precisely the instinct the rubric is built to catch. A dashboard that is 98% green can still be sitting on top of a checkout that is failing customers, and the interview spends three full phases checking whether you notice.
We will watch a capable candidate, Naomi, walk through four of the interview's follow-ups, see where technically-correct answers still cost points, and close with the full blueprint the AI interviewer scores against in real time.
Key Findings
- The rubric totals 100 points across four dimensions: Interviewer Objectives Alignment (30), Level-Specific Expectations (30), Technical Proficiency (20), and Communication & Problem Solving (20).
- The interview runs 30 minutes across 3 phases: 0-7 minutes on framing, 7-20 minutes (the longest, at 13 minutes) on metric design, and 20-30 minutes on trade-offs and business linkage.
- There are 13 expected checklist items across the three phases: 4 in framing, 5 in metric design, 4 in trade-offs.
- The full package includes 6 follow-up prompts; this walkthrough dramatizes 4 of them.
- Interviewers are explicitly checking for 5 named pitfalls: vanity metrics, flaky tests, incomplete coverage, delayed defect discovery, and misleading aggregates.
- Metric design (Phase 2) alone carries 5 of the 13 checklist items, the single heaviest phase in the interview.
- 4 topics are explicitly out of scope for this interview: whiteboard algorithms, deep performance testing methodology, security penetration testing, and organization-wide executive scorecard design.
What Does a QA Engineer Quality Metrics and Test Reporting Interview Actually Score?
The interview question
You are the QA engineer supporting a consumer-facing mobile and web checkout experience for a large e-commerce product. The team ships weekly, has automated API and UI regression coverage in CI, and receives production incidents from failed payments and order placement issues. Right now the team reports only pass and fail counts from test runs, and engineering leadership says that reporting does not tell them whether a build is ready to release or where quality is getting worse.
Three stakeholders will read whatever you build: QA and developers who want actionable test health and defect signals, an engineering manager who wants release-readiness visibility, and a product manager who cares about customer impact and conversion risk.
How would you design a quality metrics and test reporting approach for this team so that it helps stakeholders make better release and quality decisions?
The interviewer is not grading whether you can name test metrics. They are checking whether you can turn pass and fail counts into signals that three different people can act on: a QA engineer who owns the automation, a manager deciding whether to ship, and a product manager who only cares if checkout still converts. Level-Specific Expectations for a mid-level candidate call for practical, team-level metrics and dashboards, not an organization-wide measurement framework, so the bar is judgment on a manageable set of numbers, not exhaustive coverage.
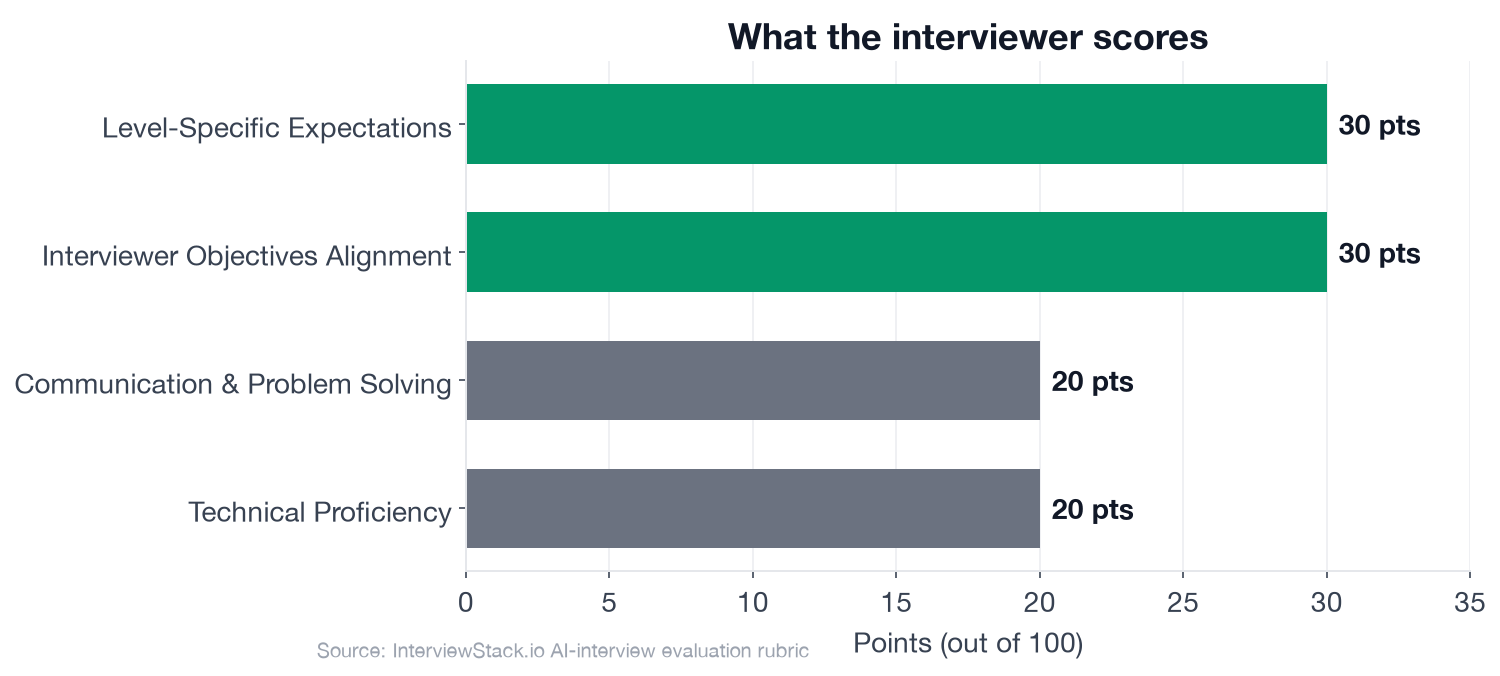 Interviewer Objectives Alignment and Level-Specific Expectations each carry 30 of the 100 points, one and a half times the weight of either Technical Proficiency or Communication & Problem Solving, so how you frame the approach matters more than any single metric you name.
The Follow-Ups That Actually Decide the Score
Naomi is a capable mid-level candidate, and on paper every answer below sounds reasonable. It is the interviewer's follow-ups, not the opening pitch, that decide the score.
Turn 1: The First Five Metrics
Interviewer: "What metrics would you put on the dashboard first, and how would you justify excluding some commonly requested metrics?"
Turn 2: One Report, Three Audiences
Interviewer: "How would you keep this reporting useful for different audiences without building completely separate systems for QA, engineering leadership, and product?"
Turn 3: When the Dashboard Lies
Interviewer: "How would you separate product quality issues from test-suite instability so the reporting stays trustworthy?"
Turn 4: The Number That Contradicts Itself
Interviewer: "Suppose two metrics conflict, for example, a high automation pass rate but rising payment-related incidents in production. How would you interpret and present that?"
What Happens When the Interviewer Won't Let a Number Stand Alone?
Spotting Naomi's four mistakes on the page is easy; every fix above is a sentence you could write given enough time. What the page cannot simulate is a 30-minute clock and an interviewer who keeps asking why, why that metric, why not that one, what happens when two of your own numbers disagree. Defending a metric choice out loud, under time pressure, with no chance to rewrite the sentence, is the actual skill this topic is testing, and it only gets built through reps in something like the AI mock interview, not through reading a walkthrough.
How Does a Strong Answer Move From Stakeholders to a Release Decision?
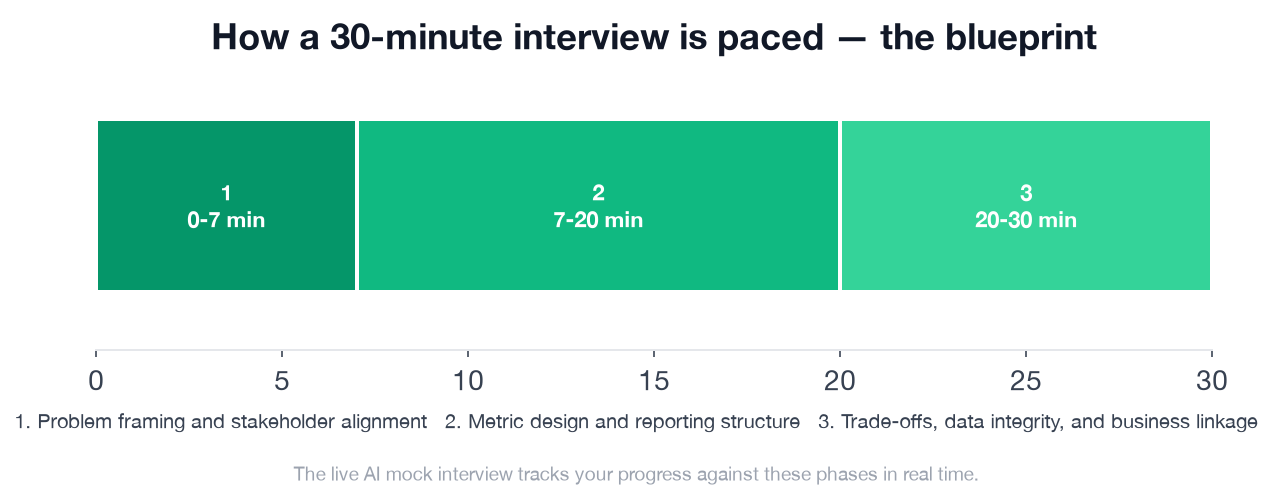 Seven minutes to frame the problem, thirteen to design the metrics and dashboard, and ten to defend trade-offs and tie the signals back to the business, in that order.
This is the shape of a strong 30-minute answer, phase by phase, and it is the exact blueprint the AI mock interviewer tracks against as you talk.
- ✓Asks or states who will consume the metrics and what decisions they need to make
- ✓Recognizes that pass/fail totals alone are insufficient for release readiness
- ✓Separates at least two dimensions of quality, such as product risk versus test execution health
- ✓Keeps the proposal grounded in the checkout/release scenario rather than abstract QA theory
- ✓Proposes a concise set of metrics such as escaped defects, defect severity trends, flaky test rate, automation stability, requirement/risk coverage, failed critical journey rate, or release blocker count
- ✓Defines what each metric means and how it would be interpreted by stakeholders
- ✓Distinguishes leading indicators from lagging indicators
- ✓Includes trend-based reporting over time instead of only point-in-time status
- ✓Suggests a release summary or dashboard view that highlights critical checkout paths and production risk
- ✓Explains how to handle flaky tests or unreliable underlying data so dashboard trust is preserved
- ✓Discusses how conflicting metrics would be investigated rather than oversimplified
- ✓Connects quality metrics to checkout business outcomes like payment success, order completion, or conversion impact
- ✓Recommends lightweight operational mechanisms such as metric ownership, review cadence, and threshold-based release discussions
Where to Practice This Scenario
Reading Naomi's four mistakes is the fast part. Running this exact scenario live, naming five metrics and defending the cut in real time, is what the QA Engineer quality metrics and test reporting mock interview is built for, and it scores you against the same rubric shown above as you go. If you want to drill the underlying concepts first, the test reporting and quality insights question bank breaks the topic into individual questions, and our preparation guides cover how other QA interview topics are structured. If cross-browser prioritization is your next gap, we also walked through a cross-browser testing interview turn by turn.
FAQ
Q. What does a QA Engineer test reporting and quality insights interview actually test?
It tests whether you can turn raw pass and fail counts into a small set of actionable metrics that three different stakeholders, QA and developers, an engineering manager, and a product manager, can use to make a release decision. The rubric weighs Interviewer Objectives Alignment and Level-Specific Expectations at 30 points each, with Technical Proficiency and Communication and Problem Solving at 20 points each, for 100 points total.
Q. What metrics should a QA Engineer put on a test reporting dashboard first?
Start with a small set that spans test effectiveness, product quality, and release readiness rather than one long list: escaped defects, defect severity trends, flaky test rate, failed critical journey rate, and release blocker count are a solid starting five. The interview rewards naming what you left off, raw test counts, for example, as much as what you included.
Q. How should QA reporting change if release velocity goes from weekly to daily?
The metrics usually stay the same; the review cadence and the decision mechanism do not. Weekly manual review does not scale to a daily ship cadence, so the interview expects you to shift toward automated, threshold-based release gates and a shorter, lighter-weight review instead of a person reading a report before every release.
Q. How do you tie QA metrics to business outcomes like checkout conversion?
Connect a technical signal to a customer-facing one directly. A rising failed critical journey rate on the payment flow, for example, maps to a drop in order completion or a spike in payment-related incidents. The interviewer is checking whether you can explain quality in terms a product manager cares about, not only in terms of test runs.
Q. How is a QA Engineer test reporting interview answer scored?
Across four dimensions worth 100 points total: Interviewer Objectives Alignment (30), Level-Specific Expectations (30), Technical Proficiency (20), and Communication and Problem Solving (20). The interview itself runs three phases: a 7-minute framing phase, a 13-minute metric design phase, and a 10-minute trade-offs and business-linkage phase, each with its own checklist.
Q. What is the most common mistake in a QA test reporting interview?
Reporting a metric that looks good, like a high automation pass rate, without checking whether it is actually measuring the right thing. A high pass rate next to rising production incidents usually means the suite is not covering the failure modes that matter, and presenting the pass rate alone as reassurance is one of the fastest ways to lose points on this topic.
Q. How can I practice this exact interview before the real thing?
Start the QA Engineer quality metrics and test reporting mock interview on InterviewStack.io, which runs the same scenario and scores you against the same rubric in real time, then use the question bank to drill the individual concepts separately if you want more repetition first.
The Metric You Cut Says More Than the One You Keep
Naomi's four mistakes are not exotic. Listing too many metrics instead of ranking them, splitting one report into three systems, letting a flaky test blend into the quality signal, and reporting a contradiction as if it were good news are four ordinary ways a technically-correct answer still reads as junior. What separates a passing score from a strong one on this topic is naming the cut out loud, before the interviewer has to ask why it is missing.
Topics
Ready to practice?
Put what you've learned into practice with AI mock interviews and structured preparation guides.